VIX serves as a reference: it relies on S&P500 options and it is calculated by the Chicago Board Options Exchange. It gives us indications upon American markets’ nervousness. It is often referred as “the fear index”.
Volatility indices are numerous. There are some on stocks (VDAX for the german DAX30, RVX for the Russell 2000…), some for commodities (OVX for Crude oil, GVZ for Gold...) and even interest rates’ indices.
“VIX” fluctuation over the past 20 years
.jpg)
We can notice that the VIX has been relatively stable for the past 5 years. On Monday, the VIX moved upward, which testified to the fact that the American stock markets are sensitive to the Greek case. Moreover, the index has only crossed 5 times the 40 points line:
- 1998 : when the Russian crisis occurred
- 2001 : in the aftermaths of 9/11
- 2002 : following Enron financial scandal
- 2008 : when the worldwide financial crisis occurred (it reached its historical maximum at 80 points)
- 2011 : during the financial storm of July, August and September
“VXN” fluctuation over the past 2 months
.jpg)
VXN is the NASDAQ’s volatility index. We notice a recent appreciation of that index that reaches levels that we haven’t seen since February 2015 (currently at 19.81 points)
“V2X” fluctuation over the past 2 years
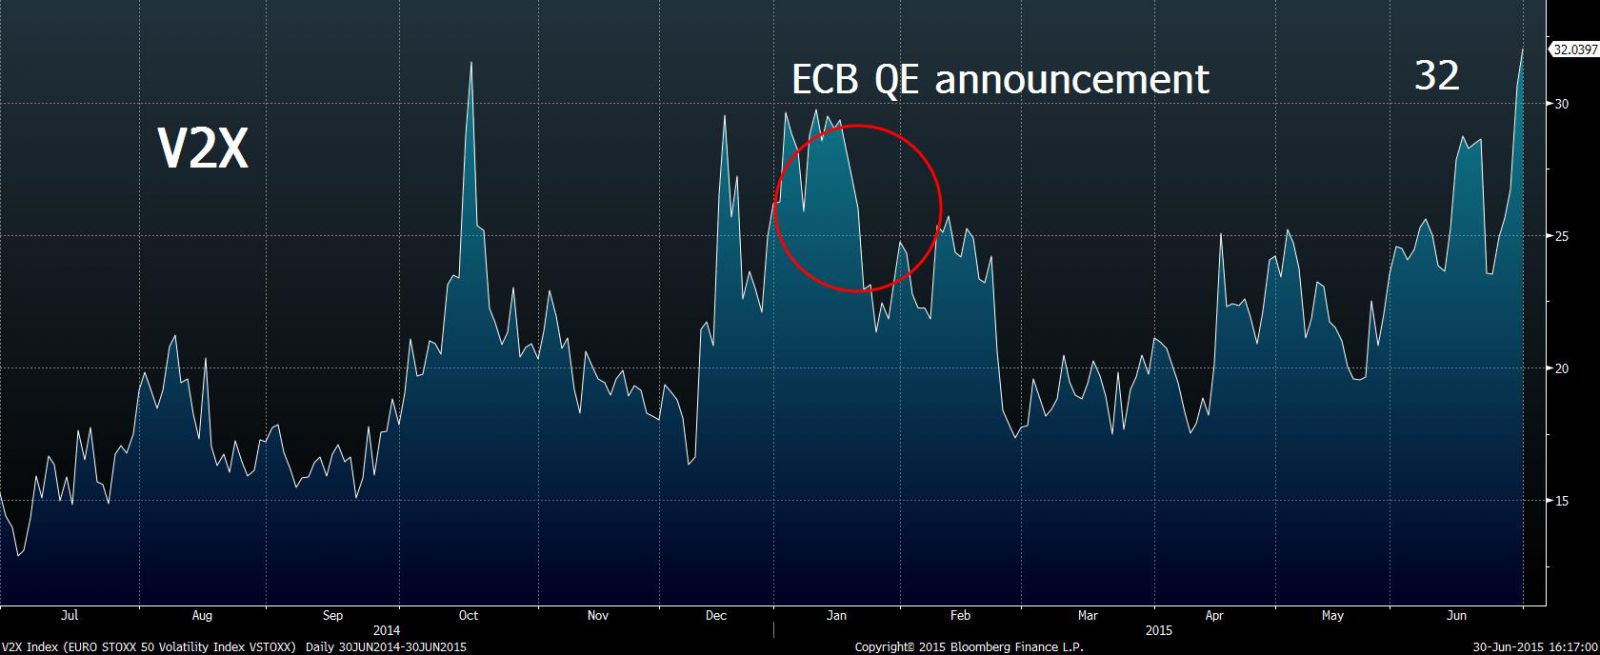
V2X is the EURO STOXX 50’s volatility index. The announcement of the implementation of the European Quantitative easing has brought a 8 points decrease on the V2X. That index has recently taken 14 points because of the Greek turmoil, which seems to affect more the Eurozone countries than others.


