Talking Points:
- Trend Line Break and Retest on Daily Chart
- "Hidden" Resistance in Play for NZD/CAD
- Helpful Validation for Intraday Shorts
Although NZDCAD is in a longer-term uptrend, the pair has recently shown signs of weakening on the daily chart (see below) and appears to be beginning a journey lower to test a longer-term uptrend. As a result, short trades are most preferable now, even though this goes against the longer-term trend.
Guest Commentary: Daily Trend Line Break in NZD/CAD
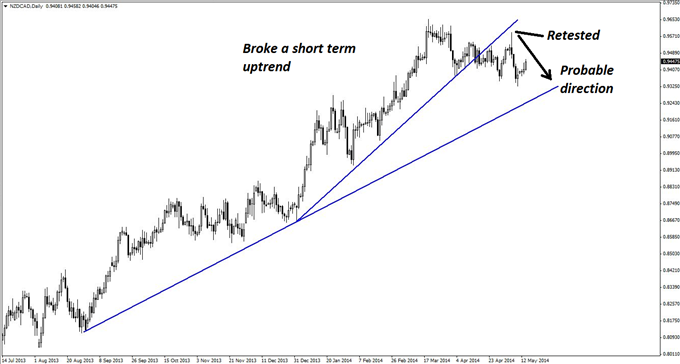
As shown, the short-term momentum trend line has been broken and retested. Although the general trend is still up, it is wiser to wait for price to reach the longer-term rising support line before attempting new longs. In the meantime, however, intraday shorts are very much in play, as there are approximately 180 pips or more to be had if price does head down to test support.
On the below four-hour chart, there is a line of resistance that is somewhat hidden due to the recent break. Nonetheless, it is valid and is likely to provide at least some kind of reaction when price next arrives there.
Guest Commentary: “Hidden” Trend Line in Play for NZD/CAD
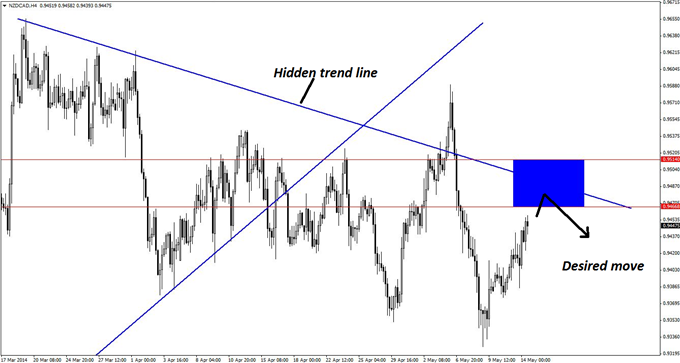
Because of the elasticity uncovered by the previous break, the current resistance area has been estimated as 0.9466-0.9514. This zone is 48 pips deep, which is very reasonable, especially since this is a (somewhat) countertrend trade.
Nonetheless, and as with all countertrend trades, at least two positions should be taken in order to enable traders to scale out swiftly at the first sign of trouble.
The hourly chart below is reassuring, as NZDCAD shows a classic rising wedge pattern while heading up towards the zone of resistance. The slope of the wedge is gradual, and this lends credence to the idea that the rise is only a pullback, and not a return of bullish momentum.
Guest Commentary: Key Validation on NZD/CAD Hourly Chart
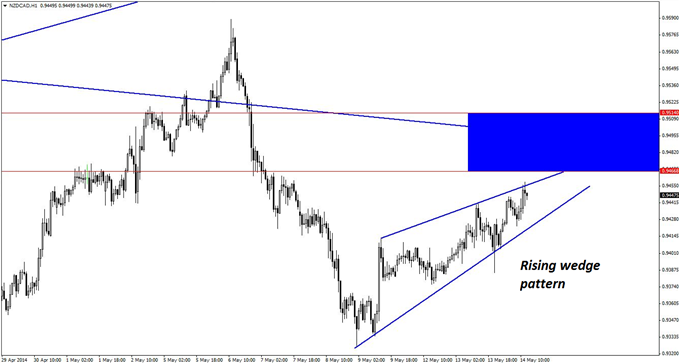
The usual entry signals will apply when trading this scenario, meaning bearish engulfing candles, pin bars, and/or bearish reversal divergence will all qualify as legitimate short-entry signals for this trade. Given how large the zone of resistance is, it may require two or three attempts at the entry before ultimately catching the move and getting potential results.
By Kaye Lee, private fund trader and head trader consultant, StraightTalkTrading.com
original source


