US 10Y CASH
The curve: What exactly are we talking about?
As with any specific profession, the lingo of interest rate traders is all the richer for it seems appropriate to give you a few keys to reading. The curve, also called a spread, represents the difference between two markets that quote in percentage (yield). Expressed in basis points, it corresponds to the subtraction between a long rate, the 10-year US for example, and a short rate, say, the 2-year. In this case, we often write 2/10 UST (for U.S. Treasuries) or 2/10 US, specifying whether we are talking about cash or swap markets. Other classic spreads are 2/30, 10/30, 5/10, 2/5 or 5/30.
This is all well and good, but what is the point?
Patience my friend, we're getting there. First of all, do you know how banks work (schematically of course)? Beyond the fact that they only lend to the rich, it is well known that they borrow money in the short term and distribute credit in the long term. In other words, they earn a return on the spread between these two interest rate levels. If the curve rises, we speak of steepening, the banks have every interest in lending to economic agents because they will earn more money. Conversely, if the curve falls, this is called flattening, and they are less inclined to lend because their margins are reduced. And when the curve turns negative - short rates are higher than long rates - not being philanthropists, they no longer have any interest in financing companies because they lose money on each loan made.
Let's take a look in the rearview mirror
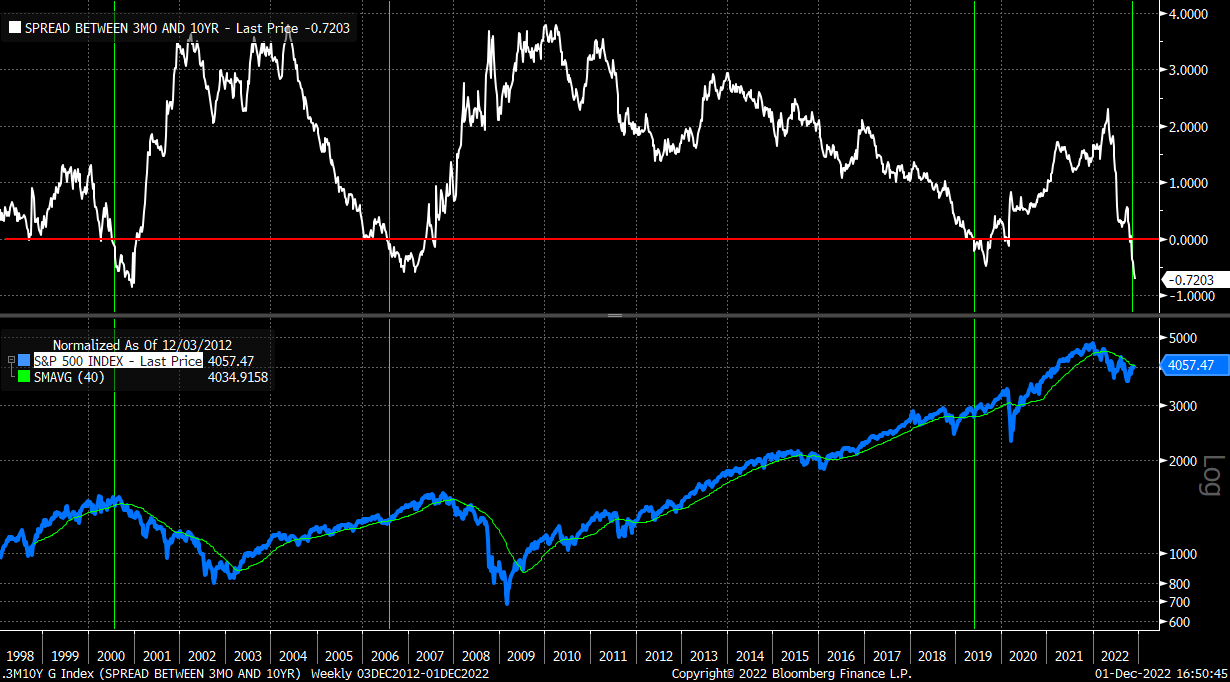
The charts below represent the spread between the 10-year and 3-month US curves since the 1960s, with the zero line in red (top) and the evolution of the S&P 500 (bottom). The red vertical columns correspond to official recession periods as defined by the National Bureau of Economic Research (NBER). Over the past 50 years, recessions have been systematically preceded by an inversion of the curve.
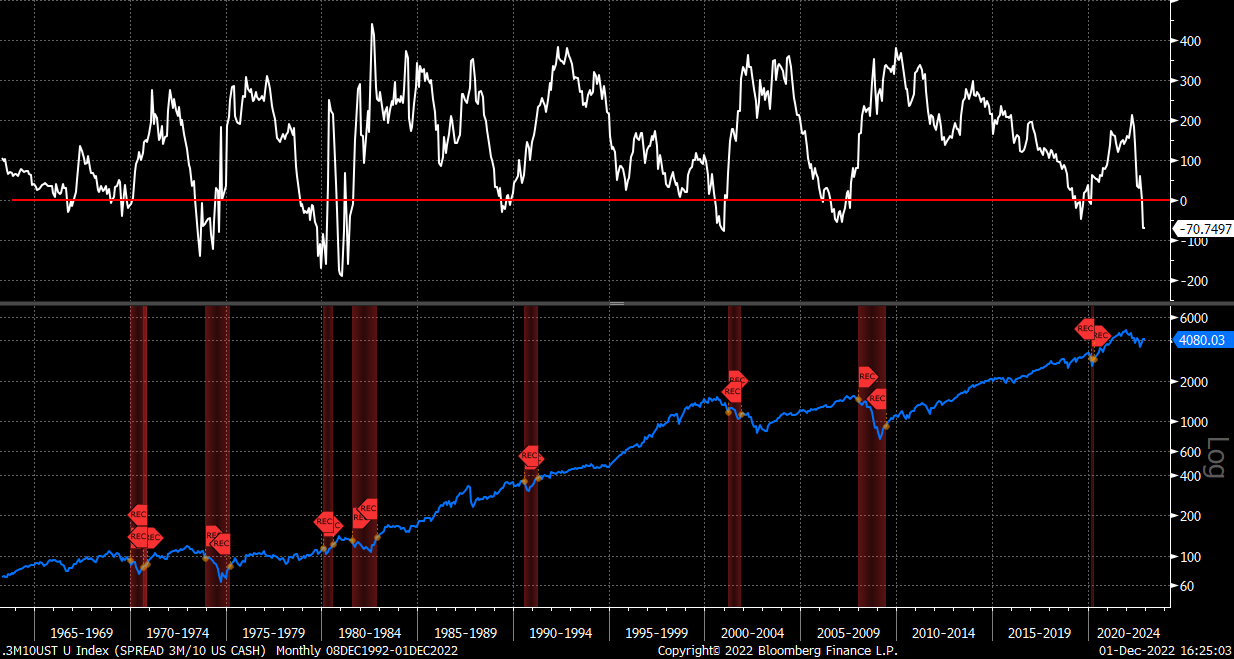
But what about now?
As you can see, the curve has been negative since October and has reached -70 basis points, the same levels as in 2000 and 2006-07. The older among us, or should I say the more experienced, will remember that the periods that followed were value-destroying to say the least. That being said, you will also notice that there is a lag between the beginning of the curve inversion and the stock market decline that can go up to 18 months (as in 2006-2007). To avoid getting caught, a good old trend following system can be useful to decide when it is better to stay away from the stock market. In this respect, the 200-day moving average (or 40-week moving average as below) does an excellent job.