








|
Market Closed -
Euronext Amsterdam
12:55:00 2026-10-30 pm EDT
|
5-day change | 1st Jan Change | ||
| 34.06 EUR | -3.95% |
|
-4.27% | -3.35% |
| Oct. 30 | Acerinox guides for lower fourth-quarter earnings, shares fall | RE |
| Oct. 06 | Genmab in Good Health, Schneider Lacks Energy |  |
Business description: Aperam S.A.

Aperam S.A. has a flat Stainless and Electrical steel capacity of 2.5 million tonnes in Brazil and Europe and is a leader in Alloys & high value specialty products with presence in France, China, India and United States. In addition to its industrial network, spread over sixteen production facilities in Brazil, Belgium, France, the United States, India & China, Aperam S.A. has a highly integrated distribution, processing and services network and a unique capability to produce low carbon footprint stainless and special steels from biomass, stainless steel scrap and high performance alloys scrap.
With Bioenergia and its unique capability to produce charcoal made from its own FSC®-certified forestry and with ELG, a global leader in collecting, trading, processing and recycling of stainless steel scrap and high performance alloys, Aperam S.A. places sustainability at the heart of its business, helping customers worldwide to excel in the circular economy, as demonstrated by its ResponsibleSteelTM certification, which ensures high standards of environmental, social, and governance (ESG) performance.
Number of employees: 13,300
Sales by Activity: Aperam S.A.
| Fiscal Period: December | 2021 (EUR) | 2022 (EUR) | 2023 (EUR) | 2024 (EUR) | 2025 (EUR) |
|---|---|---|---|---|---|
Stainless & Electrical Steel | 4.37B | 5.51B | 4.23B | 4.01B | 3.82B |
Services & Solutions | 2.21B | 2.78B | 2.26B | 2.38B | 2.13B |
Recycling & Renewables | - | 2.43B | 1.98B | 1.95B | 1.58B |
Alloys & Specialties | 518M | 665M | 889M | 919M | 1.11B |
Others & Eliminations | -2B | -3.23B | -2.76B | -3B | -2.56B |
Geographical breakdown of sales: Aperam S.A.
| Fiscal Period: December | 2021 (EUR) | 2022 (EUR) | 2023 (EUR) | 2024 (EUR) | 2025 (EUR) |
|---|---|---|---|---|---|
Germany | 1.17B | 1.51B | 1.2B | 1.23B | 1.03B |
Brazil | 1.21B | 1.43B | 1.03B | 990M | 1.01B |
United States | 167M | 1.01B | 796M | 871M | 911M |
Italy | 693M | 877M | 711M | 672M | 705M |
France | 298M | 362M | 305M | 295M | 275M |
Spain | 124M | 296M | 260M | 198M | 262M |
South Korea | 81M | 113M | 156M | 185M | 233M |
Others Europe | 587M | 343M | 269M | 275M | 227M |
Belgium | 159M | 357M | 254M | 214M | 189M |
United Kingdom | 66M | 280M | 241M | 201M | 162M |
Poland | 165M | 188M | 148M | 151M | 129M |
China | 59M | 66M | 99M | 82M | 126M |
Czech Republic | - | 138M | 113M | 111M | 110M |
Austria | - | 134M | 117M | 101M | 104M |
Taiwan | - | 166M | 177M | 137M | 104M |
Netherlands | 77M | 111M | 84M | 78M | 104M |
Switzerland | - | 126M | 128M | 134M | 90M |
Turkey | 90M | 117M | 85M | 68M | 58M |
Finland | - | 236M | 49M | 43M | 48M |
India | 13M | 45M | 64M | 44M | 48M |
Canada | - | - | - | - | 38M |
Others Asia & Africa | 24M | 30M | 40M | 30M | 34M |
Argentina | 51M | 94M | 111M | 48M | 32M |
Vietnam | 26M | 27M | 24M | 23M | 21M |
Others Americas | 44M | 71M | 109M | 55M | 19M |
Japan | - | 14M | 14M | 13M | 12M |
Australia | - | 12M | 6M | 5M | 6M |
United Arab Emirates | 1M | - | - | - | - |
Executive Committee: Aperam S.A.
| Manager | Title | Age | Since |
|---|---|---|---|
Sudhakar Sivaji
CEO | Chief Executive Officer | 47 | 2025-12-31 |
Nicolas Changeur
DFI | Director of Finance/CFO | 55 | 2025-09-30 |
| Investor Relations Contact | - | - | |
Bert Lyssens
HRO | Human Resources Officer | 57 | 2015-03-31 |
Jan Hofmann
PRN | Corporate Officer/Principal | 47 | - |
Composition of the Board of Directors: Aperam S.A.
| Director | Title | Age | Since |
|---|---|---|---|
| Chairman | 75 | 2010-12-05 | |
Aditya Mittal
BRD | Director/Board Member | 50 | 2010-12-05 |
Timoteo Di Maulo
BRD | Director/Board Member | 67 | 2025-12-31 |
Rosalind Rivaz
BRD | Director/Board Member | 71 | 2020-05-04 |
| Director/Board Member | 65 | 2019-04-30 | |
Alain Kinsch
BRD | Director/Board Member | 54 | 2020-04-30 |
Roberte Kesteman
BRD | Director/Board Member | - | 2022-05-03 |
Holdings: Aperam S.A.
| Name | Stocks | % | Valuation |
|---|---|---|---|
APERAM S.A. 1.15% | 842,907 | 1.15% | 42 M $ |
Company details: Aperam S.A.
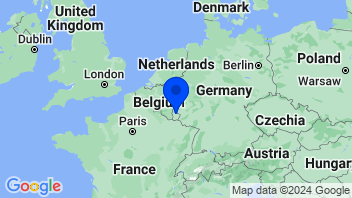
Group companies: Aperam S.A.
| Name | Category and Sector |
|---|---|
ELG Recycling Processors Pty Ltd.
 ELG Recycling Processors Pty Ltd. Wholesale DistributorsDistribution Services Engages in trading steel alloys & related scarp products |
Wholesale Distributors
|
Aperam Stainless Services & Solutions Italy Srl
 Aperam Stainless Services & Solutions Italy Srl SteelNon-Energy Minerals Produces and commercializes stainless steel products |
Steel
|
APERAM Stainless Services & Solutions Germany GmbH
 APERAM Stainless Services & Solutions Germany GmbH SteelNon-Energy Minerals Manufactures and supplies steel sheets and coils |
Steel
|
APERAM Treasury SCA
 APERAM Treasury SCA Financial ConglomeratesFinance Provides financial services |
Financial Conglomerates
|
APERAM Stainless Services & Solutions Luxembourg SA
 APERAM Stainless Services & Solutions Luxembourg SA SteelNon-Energy Minerals Engages in production and distribution of stainless products |
Steel
|
Iron, Steel Mills & Foundries
| Change | 5-day change | 1-year change | 3-year change | Capi.($) | ||
|---|---|---|---|---|---|---|
 | -3.95% | -4.27% | +10.01% | +33.10% | 2.76B | |
| -0.52% | +6.11% | +82.90% | +83.87% | 62.13B | |
| -17.34% | +0.19% | -2.81% | -9.03% | 48.61B | |
| -2.15% | +0.56% | +60.43% | +164.69% | 45.13B | |
| -1.08% | +3.84% | +58.55% | +139.79% | 35.67B | |
| -0.50% | +4.89% | +2.90% | +69.60% | 32.01B | |
| -2.19% | 0.00% | -33.57% | -35.95% | 30.87B | |
| -0.64% | +5.12% | +56.10% | +72.92% | 22.26B | |
| -1.06% | +0.27% | -9.03% | +40.75% | 22.05B | |
| -0.41% | +0.38% | +2.08% | +1.06% | 21.78B | |
| Average | -2.98% | +1.71% | +22.76% | +56.08% | 32.33B | |
| Weighted average by Cap. | -3.56% | +2.55% | +30.96% | +64.79% |

Trader
This super rating is the result of a weighted average of the rankings based on the following ratings: Valuation (Composite), EPS Revisions (4 months), and Visibility (Composite). We recommend that you carefully review the associated descriptions.
Investor
This super composite rating is the result of a weighted average of the rankings based on the following ratings: Fundamentals (Composite), Valuation (Composite), EPS Revisions (1 year), and Visibility (Composite). We recommend that you carefully review the associated descriptions.
Global
This composite rating is the result of an average of the rankings based on the following ratings: Fundamentals (Composite), Valuation (Composite), Financial Estimates Revisions (Composite), Consensus (Composite) and Visibility (Composite). The company must be covered by at least 4 of these 5 ratings for the calculation to be carried out. We recommend that you carefully review the associated descriptions.
Quality
This composite rating is the result of an average of rankings based on the following ratings: Returns (Composite), Profitability (Composite) and Quality of Financial Reporting (Composite), and Financial Health (Composite). The company must be covered by at least 2 of these 3 ratings for the calculation to be performed. We recommend that you carefully read the associated descriptions.
ESG MSCI
The MSCI ESG score assesses a company’s environmental, social, and governance practices relative to its industry peers. Companies are rated from CCC (laggard) to AAA (leader). This rating helps investors incorporate sustainability risks and opportunities into their investment decisions.


Quarterly revenue - Rate of surprise


- Stock Market
- Stocks
- APAM Stock
- Company Aperam S.A.
Select your edition
All financial news and data tailored to specific country editions


