Talking Points:
- Clear Downtrend in EUR/NOK
- Key Technical and Fundamental Factors
- Why the Best Trade Is No Trade at All
Mixed technical and fundamental signals for EUR/NOK has made for an environment where risk is difficult to control and patience is likely the most prudent strategy.
As mentioned in previous analysis, since peaking early this year, EUR/NOK has entered a confirmed downtrend marked by lower highs and lower lows. At current levels, though, we notice strong horizontal support around the 8.18-8.20 area, which was our first price target for initial short positions.
See related: Second-Chance Short Set-up in EUR/NOK
Current strength in the Norwegian krone (NOK) versus the euro (EUR) is being supported by stronger-than-expected economic data from Norway, which includes improving housing prices and inflation figures.
In addition, Norges Bank surprised the market following the March policy meeting by not reducing the current rate path and delivering a more hawkish economic outlook than what had been initially priced in.
In general, the euro has been battling downward pressure of late, with the European Central Bank (ECB) holding open the possibility for future easing and other monetary policy actions intended to fuel Eurozone economic growth.
The primary question at this time is whether upbeat economic numbers from Norway will help NOK build momentum, or if the recent strength is just another ‘’dead cat bounce” before the real market conditions are revealed.
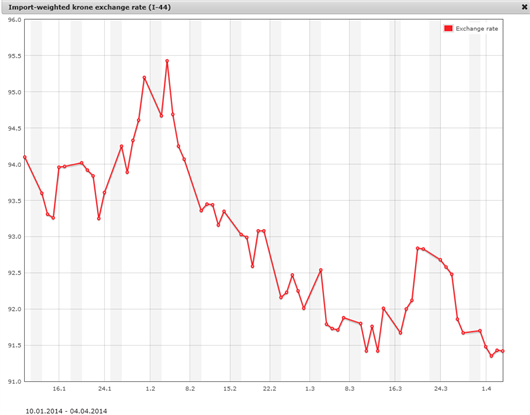
Recent economic strength in Norway was supported by a weaker krone in early 2014, but this effect should now be reversed with NOK currently at its year-to-date high, as measured by the I-44 index (see below). This is a nominal effective exchange rate index that compares Norway’s rates to those of the country’s most important trading partners. As such, a rising I-44 index indicates NOK weakness.
I-44 Index Shows NOK Weakness
The shorter-term trend for EUR/NOK is pretty clear, with lower highs and lower lows since the early-2014 peak above 8.50. At current levels, however, we can see the nearby horizontal support area between 8.18 and 8.20. Should EUR/NOK break and close below this range, we should expect further downside to the next support area between 8.10 and 8.00.
However, we also see a positive divergence between price and the moving average convergence/divergence (MACD) indicator. This may support a short-term reversal from current levels, or even a potential double-bottom formation in the bigger picture. Key upside levels include 8.40 and the yearly high around 8.55.
Technical Outlook for EUR/NOK
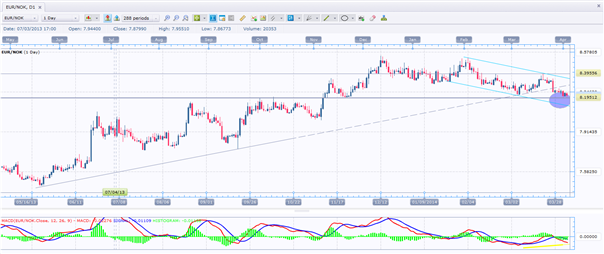
Support: 8.20-8.18, 8.10, 8.00-7.95
Resistance: 8.30, 8.40, and 8.55
Playing the Waiting Game for EUR/NOK
It’s clear that there are a lot of uncertainties in EUR/NOK for the time being. From our latest research, the trade idea was to enter new short positions from the 8.3750 - 8.41 area. The first target price (8.20) was reached, and those who are currently holding short positions should either consider booking partial profits or may reduce overall risk by using a stop-loss.
Sometimes the best trade is no trade at all, and for now, the chart and the underlying fundamentals in both Norway and the Eurozone do not necessarily offer a clear picture about the next big move in EUR/NOK.
It’s critical to have a high-quality set-up and good overall risk profile before entering any position in the market. Play hard when the risk ratio is on your side, and in consolidating and/or uncertain market conditions like the present, it’s best to simply play safe.
By Rafiul Hossain, Guest Analyst, DailyFX.com
original source

