CHARLOTTE, N.C., June 6, 2018 /PRNewswire/ -- CompareCards by LendingTree today released the findings of its study on the places that use the most retail credit and charge cards. The study found that some metro areas are home to heavy users of retail cards while other locations have a population who use retail cards more sparingly.
Using TransUnion credit data from users of My LendingTree, the free credit monitoring service of the parent company of CompareCards, the study uncovers retail and charge card usage for 100 of the most populated metropolitan areas.
Nationally, 61.3 percent of credit card owners have at least one retail card. Of those who have at least one retail card, 30.4 percent carry a balance on a retail card, representing 11.4 percent of outstanding balances. The average balance on a retail card in the U.S. is $2,699.
Highlights from the report:
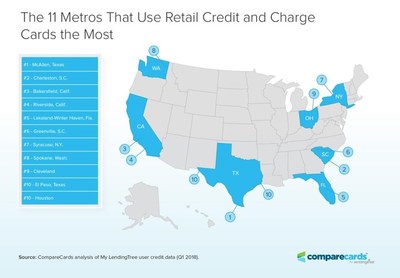
- Residents of McAllen, Texas are by far the highest users of retail credit and charge cards. The metro earned a final score of 87.2 and ranked first in these categories:
- The number of people who have retail cards (72%)
- The number of retail card owners who carry a balance on their retail cards (45%)
- And the percentage of credit card debt carried on a retail card (17%)
- People in Charleston, S.C. have this retail card claim to fame: They carry the highest balances on their retail cards among all 100 metros, with an average balance of $4,026 and a median balance of $1,746. Meanwhile, Albany, N.Y. had the lowest average balance ($2,420).
- Honolulu has the lowest retail card usage, with a final score of 9.4. Although it didn't rank last in any individual category, it ranked extremely low in all.
Where people use the most retail cards
McAllen, Texas is the clear leader for retail card usage with a score of 87.2. A whopping 72.4 percent have retail credit cards, and 45.1 percent carry a balance on their card. The average retail card balance is $3,207. Credit card users also have 17 percent of their total credit card debt sitting on retail credit cards, the highest percentage in the study.
Charleston, S.C. lands a score of 68.8 with 63.4 percent having retail credit cards. Although this location is second on the list, Charleston has the highest average balance on retail cards ($4,026), and 32.9 percent who have a retail card carry a balance. Retail balances make up 13.1 percent of their total credit card debt.
Bakersfield, Calif. rounds out the top three locations that use the most retail cards with a score of 66.1, and an average retail card balance of $3,053. A sizeable 68.1 percent of people have retail cards, 37.3 percent keep a balance on their cards, and retail card balances make up 14.5 percent of their total credit card debt.
In Riverside, Calif., 66.4 percent have retail cards with 36.5 percent carrying a balance. The average retail credit card debt is $3,115, and 13.7 percent of people's total credit card debt is sitting on retail cards.
Lakeland-Winter Haven, Fla. earns a score of 60.9 to take fifth place. This location has the second highest average balance on retail cards ($3,628). However, only 60.8 percent use retail cards, and 34 percent carry a balance. On average, retail card balances make up 12.9 percent of their total credit card debt.
To view the full report, visit: http://www.comparecards.com/blog/places-that-use-the-most-retail-credit-and-charge-cards/.
Metros That Use Retail Credit and Charge Cards the Most | |||||||
Rank | Metro | Final Score | Average Balance on Retail Cards | % Who Have Retail Cards |
% Who Carry a Balance on Retail Cards | Average % of Total Card Balance Carried on Retail Cards | |
1 | McAllen, Texas | 87.2 | $3,207 | 72.4% | 45.1% | 17.0% | |
2 | Charleston, S.C. | 68.8 | $4,026 | 63.4% | 32.9% | 13.1% | |
3 | Bakersfield, Calif. | 66.1 | $3,053 | 68.1% | 37.3% | 14.5% | |
4 | Riverside, Calif. | 62.5 | $3,115 | 66.4% | 36.5% | 13.7% | |
5 | Lakeland-Winter Haven, Fla. | 60.9 | $3,628 | 60.8% | 34.0% | 12.9% | |
6 | Greenville, S.C. | 59.7 | $3,244 | 60.3% | 34.8% | 14.6% | |
7 | Syracuse, N.Y. | 59.5 | $3,424 | 66.0% | 34.9% | 11.5% | |
8 | Spokane, Wash. | 58.5 | $2,863 | 63.5% | 35.0% | 15.1% | |
9 | Cleveland | 57.1 | $3,066 | 62.6% | 34.9% | 13.8% | |
10 | El Paso, Texas | 56.9 | $2,896 | 65.3% | 39.2% | 12.3% | |
10 | Houston | 56.9 | $3,381 | 62.6% | 33.2% | 12.6% | |
12 | Stockton, Calif. | 56.8 | $2,956 | 66.5% | 34.4% | 13.2% | |
13 | Austin, Texas | 56.5 | $3,509 | 62.7% | 31.3% | 12.3% | |
13 | Charlotte, N.C. | 56.5 | $3,320 | 62.6% | 32.6% | 13.0% | |
15 | Toledo, Ohio | 56.1 | $3,184 | 62.6% | 33.3% | 13.4% | |
16 | Pittsburgh | 55.7 | $3,240 | 65.9% | 33.7% | 11.7% | |
17 | Columbus, Ohio | 55.4 | $3,311 | 62.2% | 31.7% | 13.1% | |
18 | Providence, R.I. | 55.2 | $3,234 | 66.3% | 34.9% | 11.0% | |
19 | Akron, Ohio | 54.4 | $3,025 | 66.7% | 33.4% | 12.3% | |
20 | Rochester, N.Y. | 53.9 | $3,082 | 66.3% | 34.1% | 11.6% | |
21 | Indianapolis | 53.7 | $3,200 | 63.6% | 32.2% | 12.5% | |
22 | Greensboro, N.C. | 53.6 | $3,205 | 61.8% | 33.1% | 12.7% | |
23 | Tampa, Fla. | 53.2 | $3,346 | 63.0% | 32.4% | 11.6% | |
24 | Buffalo, N.Y. | 52.6 | $3,246 | 66.0% | 33.2% | 10.7% | |
25 | Augusta, Ga. | 52 | $3,469 | 60.3% | 31.1% | 11.8% | |
25 | Nashville, Tenn. | 52 | $3,196 | 62.8% | 29.7% | 13.0% | |
27 | Little Rock, Ark. | 51.9 | $3,271 | 61.2% | 32.0% | 12.3% | |
28 | Cincinnati | 51.8 | $3,251 | 62.6% | 30.8% | 12.3% | |
29 | Fresno, Calif. | 51.5 | $2,694 | 66.6% | 35.3% | 12.4% | |
30 | Dallas | 51.3 | $3,344 | 61.9% | 31.2% | 11.7% | |
30 | Daytona Beach, Fla. | 51.3 | $3,153 | 63.4% | 32.7% | 11.8% | |
32 | Sarasota, Fla. | 50.9 | $3,158 | 65.8% | 31.6% | 11.2% | |
33 | Oklahoma City | 50.8 | $3,098 | 60.5% | 31.2% | 13.4% | |
34 | Albany, N.Y. | 50.6 | $2,420 | 69.9% | 33.4% | 13.2% | |
35 | Boise City, Idaho | 50.3 | $2,768 | 65.5% | 31.7% | 13.2% | |
36 | Raleigh, N.C. | 50.2 | $3,268 | 62.7% | 30.0% | 11.9% | |
36 | Richmond, Va. | 50.2 | $3,288 | 61.4% | 31.2% | 11.8% | |
38 | Tucson, Ariz. | 49.5 | $3,174 | 61.2% | 30.8% | 12.4% | |
39 | Fort Myers, Fla. | 49.3 | $3,297 | 62.4% | 30.5% | 11.3% | |
40 | Columbia, S.C. | 49 | $3,368 | 58.0% | 30.8% | 12.2% | |
40 | Tulsa, Okla. | 49 | $3,178 | 59.4% | 29.6% | 13.2% | |
42 | Allentown, Pa. | 48.6 | $3,030 | 65.2% | 33.3% | 10.7% | |
43 | Louisville, Ky. | 47.9 | $3,057 | 63.0% | 30.2% | 12.1% | |
44 | Dayton, Ohio | 47.5 | $2,970 | 61.0% | 32.0% | 12.4% | |
45 | Oxnard, Calif. | 47.3 | $3,130 | 64.7% | 30.5% | 10.8% | |
46 | New Haven, Conn. | 47.2 | $2,915 | 65.8% | 34.0% | 10.4% | |
47 | Detroit | 46.8 | $3,096 | 62.3% | 31.7% | 11.2% | |
48 | Chattanooga, Tenn. | 46.3 | $3,071 | 60.3% | 29.8% | 12.5% | |
48 | Seattle | 46.3 | $2,805 | 63.0% | 32.7% | 12.0% | |
50 | Orlando, Fla. | 45.4 | $3,070 | 61.5% | 31.7% | 11.1% | |
51 | Birmingham, Ala. | 44.6 | $3,002 | 60.3% | 30.4% | 12.1% | |
52 | Colorado Springs, Colo. | 44.4 | $3,225 | 61.3% | 28.4% | 11.1% | |
52 | Miami | 44.4 | $3,112 | 62.2% | 31.3% | 10.4% | |
54 | Winston-Salem, N.C. | 44.3 | $2,824 | 59.8% | 32.3% | 12.4% | |
55 | Jacksonville, Fla. | 44.1 | $3,268 | 59.9% | 29.9% | 10.7% | |
55 | Melbourne, Fla. | 44.1 | $2,969 | 63.5% | 30.4% | 11.0% | |
57 | Hartford, Conn. | 43.8 | $3,052 | 65.5% | 31.9% | 9.2% | |
58 | Memphis, Tenn. | 43.4 | $3,023 | 57.5% | 30.8% | 12.3% | |
59 | Scranton, Pa. | 43 | $2,942 | 58.9% | 29.7% | 12.5% | |
60 | Knoxville, Tenn. | 42.5 | $3,155 | 60.3% | 27.7% | 11.4% | |
61 | Durham, N.C. | 42.2 | $3,055 | 59.5% | 28.7% | 11.7% | |
62 | Virginia Beach, Va. | 42.1 | $3,292 | 59.2% | 29.2% | 10.3% | |
63 | Los Angeles | 41.7 | $3,009 | 60.3% | 29.9% | 11.1% | |
64 | Grand Rapids, Mich. | 41.6 | $2,860 | 62.2% | 28.6% | 11.8% | |
65 | Atlanta | 41 | $3,157 | 58.7% | 29.4% | 10.8% | |
66 | Harrisburg, Pa. | 40.6 | $2,822 | 64.2% | 30.8% | 10.2% | |
67 | Sacramento, Calif. | 40.4 | $2,936 | 62.0% | 28.6% | 11.0% | |
68 | Phoenix | 40.3 | $3,004 | 61.1% | 28.2% | 11.0% | |
69 | San Francisco | 40.2 | $2,883 | 63.5% | 29.0% | 10.5% | |
70 | Washington | 40 | $3,542 | 58.5% | 26.1% | 9.5% | |
71 | Chicago | 39.8 | $2,843 | 61.6% | 31.2% | 10.5% | |
72 | Worcester, Mass. | 39.7 | $3,111 | 62.7% | 29.6% | 9.2% | |
73 | Las Vegas | 39.4 | $2,959 | 61.5% | 30.0% | 10.1% | |
74 | Baltimore | 38.6 | $3,061 | 60.4% | 28.7% | 10.1% | |
75 | Baton Rouge, La. | 38.5 | $2,964 | 57.7% | 28.4% | 11.6% | |
76 | Wichita, Kan. | 37 | $2,779 | 60.0% | 29.4% | 11.0% | |
77 | New York | 36 | $3,016 | 61.5% | 29.7% | 8.7% | |
78 | Kansas City, Mo. | 35.5 | $2,855 | 59.1% | 28.5% | 10.6% | |
78 | Minneapolis | 35.5 | $3,004 | 60.2% | 27.1% | 9.9% | |
80 | Denver | 35 | $3,017 | 59.8% | 26.1% | 10.2% | |
81 | New Orleans | 34.4 | $2,858 | 57.1% | 28.4% | 11.0% | |
81 | Philadelphia | 34.4 | $2,834 | 60.5% | 29.3% | 9.6% | |
83 | Omaha, Neb. | 34.3 | $2,857 | 60.8% | 28.5% | 9.6% | |
84 | Albuquerque, N.M. | 34 | $2,722 | 59.1% | 27.8% | 11.1% | |
85 | Ogden, Utah | 33 | $2,673 | 59.7% | 26.2% | 11.4% | |
86 | Springfield, Mass. | 32.9 | $2,931 | 58.1% | 24.3% | 11.1% | |
87 | Jackson, Miss. | 32.2 | $2,734 | 55.0% | 27.7% | 11.8% | |
88 | St. Louis | 30.9 | $3,081 | 56.3% | 24.4% | 10.1% | |
89 | Des Moines, Iowa | 30.8 | $2,737 | 60.2% | 27.9% | 9.5% | |
90 | Bridgeport, Conn. | 30.1 | $2,843 | 61.3% | 28.1% | 8.2% | |
91 | San Antonio | 29.4 | $3,408 | 54.2% | 22.5% | 9.1% | |
92 | Milwaukee | 28.1 | $2,702 | 58.9% | 26.6% | 9.6% | |
93 | Portland, Ore. | 27.9 | $2,721 | 60.4% | 27.0% | 8.8% | |
94 | Boston | 26.4 | $2,797 | 59.7% | 25.7% | 8.5% | |
95 | San Jose, Calif. | 24.9 | $2,851 | 57.9% | 26.3% | 8.0% | |
96 | Salt Lake City | 21.2 | $2,858 | 54.4% | 22.7% | 9.1% | |
97 | Madison, Wis. | 18 | $2,506 | 57.4% | 23.2% | 8.7% | |
98 | San Diego | 14.1 | $2,935 | 45.4% | 21.7% | 9.5% | |
99 | Provo, Utah | 13.4 | $2,658 | 52.4% | 19.6% | 9.2% | |
100 | Honolulu | 9.4 | $2,716 | 49.7% | 20.3% | 8.1% | |
Methodology
LendingTree analysts looked at a sample of anonymized users who logged into My LendingTree the first quarter of 2018. From this sample, they calculated how many of them had retail credit and charge cards, and then calculated statistics related to their balances. Four statistics were the areas of focus:
- Percentage of credit card owners who have at least one retail card.
- Average balance on retail cards, among those who have them.
- Percentage who carry a balance on retail cards.
- Average percentage of credit card and charge card balances that are held on retail cards.
The results were aggregated to the 100 largest metropolitan statistical areas by population. To rank results, each metro was scored by summing the normalized value (relative to other metros) of each of the four statistics and then dividing that sum by four, for a highest possible score of 100 and a lowest possible score of 0.
In this study, retail cards are defined as revolving credit cards or charge accounts under the following industry codes: Clothing; Home Furnishings; Department & Variety Stores; Automotive; Oil Companies; Jewelry & Cameras; Lumber/Building Material/Hardware; and Sporting Goods. Farm & Garden Supplies are not included since these appeared to include mostly heavy agricultural equipment suppliers.
About LendingTree
LendingTree (NASDAQ: TREE) is the nation's leading online loan marketplace, empowering consumers as they comparison-shop across a full suite of loan and credit-based offerings. LendingTree provides an online marketplace which connects consumers with multiple lenders that compete for their business, as well as an array of online tools and information to help consumers find the best loan. Since inception, LendingTree has facilitated more than 65 million loan requests. LendingTree provides free monthly credit scores through My LendingTree and access to its network of over 500 lenders offering home loans, personal loans, credit cards, student loans, business loans, home equity loans/lines of credit, auto loans and more. LendingTree, LLC is a subsidiary of LendingTree, Inc. For more information go to www.lendingtree.com, dial 800-555-TREE, like our Facebook page and/or follow us on Twitter @LendingTree.
About CompareCards:
CompareCards' mission is to help people make smarter, more informed, healthier financial decisions based on deeper knowledge of financial offers. Each month, over 2.9 million visitors come to CompareCards' website to independently compare credit cards side-by-side and choose a credit card based on interest rate, reward benefit, cost savings, and other factors that are important to each person. CompareCards provides easy-to-use, objective tools and educational resources that help people do everything from making credit card comparisons to managing their credit health. For more information, please visit www.comparecards.com.
MEDIA CONTACT:
Megan Greuling
704-943-8208
Megan.greuling@lendingtree.com
![]()
![]() View original content with multimedia:http://www.prnewswire.com/news-releases/comparecards-study-reveals-which-places-use-the-most-retail-credit-and-charge-cards-300660929.html
View original content with multimedia:http://www.prnewswire.com/news-releases/comparecards-study-reveals-which-places-use-the-most-retail-credit-and-charge-cards-300660929.html
SOURCE CompareCards

