Talking Points:
- USD/CAD Technical Strategy: 6-Month Breakout Higher Within 1*ATR (5)
- Trader Sentiment Warns That Evidence Of A Move Higher Could Be Building
- Looking For Clear Short-Term USD/CAD Levels Updating In Real-Time? Check Out GSI
Quick Fundamental Take:
The Canadian Dollar has very little reasons to go bid. Recently, we heard the Bank of Canada note that the risks for inflation had, “tilted somewhat to the downside.” The lower inflation expectations align with the weaker economic data coming from Canada and the potential for a re-emergence of policy divergence, and current account divergence from Canada from other developed economies.
For now, the most notable focus is on USD/CAD and EUR/CAD. Both pairs favor upside given the fundamental and technical development in September. One helpful component of the Canadian Economy has been their exposure to Emerging Markets and how exports were expected to help Canada come out of its economic slump that is shown through the Citi Economic Surprise Index for Canada that is showing its worst rating since January when USD/CAD was trading in the mid-1.4000s.
Access Our Free Q3 Dollar Outlook As The US Dollar Reserve Status Makes It A Possible Haven
As markets await the final week before the Central bank combination of September 21 of the Bank of Japan, Federal Reserve, and Reserve Bank of New Zealand we see a clear shift toward Commodity FX and EMFX selling.
The risk-off tone has weakened the Canadian Dollar across majors, and USD/CAD could soon be trading at 6-month highs if 1.3253 is broken.
Technical Focus:
Interested In Learning the Traits of FXCM’s Successful Traders? If So,Click Here
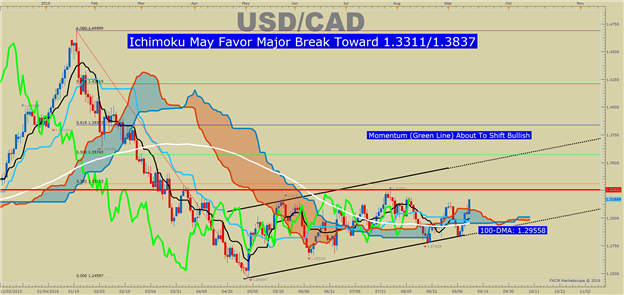
The Canadian Dollar has fallen by 1% on Tuesday, but what is more attention-grabbing are the technical developments, in addition to the Fundamental components described above that are behind the move. First, you’ll notice the rising trendline that has supported the price of USD/CAD, which has recently pushed the pair above the Ichimoku Cloud.
The Daily Chart with Ichimoku applied shows what could be a fierce breakout. Currently, the price and momentum (green line) are above the cloud which means the path of least resistance is higher. One level that is standing in the way of USD/CAD upside appears to be the July high of 1.3253. If USD/CAD can see a daily close above 1.3253, we could be well on our way to the 38.2%-61.8% Fibonacci Retracement zone of the January-May decline. This zone stretches from 1.3311 up to 1.3837.
Another component worth mentioning is that the 100-DMA (1.2955) is currently turning higher and supporting price. If the price of USD/CAD can remain above 1.2955, there would be building technical evidence to favor an upside bias while looking for opportunities to buy dips.
Having a Hard Time Trading USD/CAD? This May Be Why
USD/CAD Speculative Sentiment Index as of Tuesday, September 13, 2016
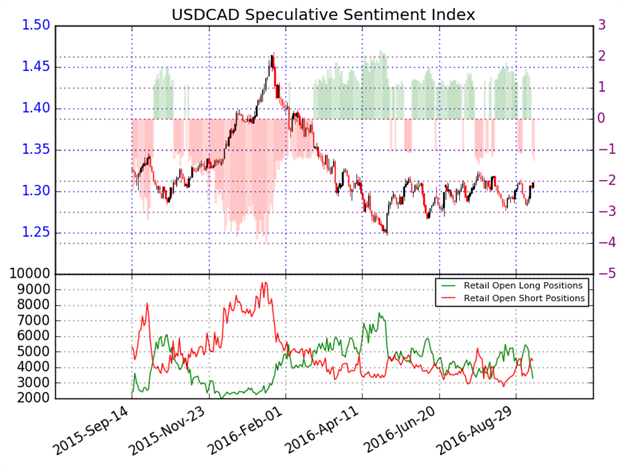
As of mid-day Tuesday, the ratio of long to short positions in the USDCAD stands at -1.61 as 38% of traders are long. Yesterday the ratio was -1.23; 45% of open positions were long. Long positions are 23.2% lower than yesterday and 44.5% below levels seen last week. Short positions are 0.6% higher than yesterday and 43.0% above levels seen last week. Open interest is 10.1% lower than yesterday and 6.7% below its monthly average.
We use our SSI as a contrarian indicator to price action, and the fact that the majority of traders are short gives a signal that the USDCAD may continue higher. The trading crowd has grown further net-short from yesterday but unchanged since last week. The combination of current sentiment and recent changes gives a further bullish trading bias.
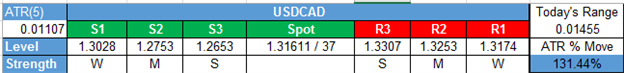
Key Levels as of Tuesday, September 13, 2016
T.Y.
Showcase your trading skills against your peers in FXCM's $10,000 Monthly Challenge with a Mini Account.
original source


