Talking Points:
- Weekly Breakout in Progress for NZD/CHF
- A "Bounce" Trade Scenario on the Daily Chart
- One Strategy to Capitalize on Both Scenarios
Although many currencies are either range-bound or offering only countertrend opportunities, NZDCHF is trading amid some potentially interesting conditions.
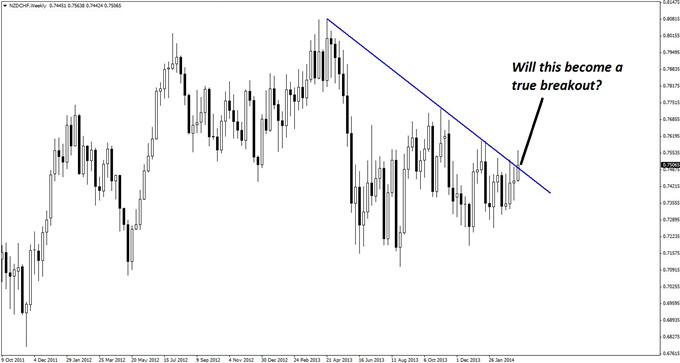
Regular readers are likely used to our traditional assumption that initial breakouts are likely to prove false, and as such, many may be surprised by this particular set-up. In this case, the weekly candlestick has breached the declining line of resistance, and while we would normally look for an opportunity to short on a lower time frame, such an opportunity has already passed.
What remains is the potential that this week may end with a strong close above resistance, thus continuing the upward price action. As a result, the trade is bullish and consistent with the direction of the breakout.
Guest Commentary: Weekly Breakout in Progress for NZD/CHF
However, just because the strategy differs somewhat from the norm, it does not mean that traders should stray from the philosophy of minimizing risk.
The daily chart below shows why multiple-time-frame analysis can be crucial. Where the weekly chart above does not show confirmation, the daily chart looks much more convincing. Of course, price can still break right back into the consolidation zone, but this should provide at least a reasonable bounce that traders on the hourly chart can take advantage of. If it develops into a trend continuation on the weekly chart, then there is potential for movement in the hundreds of pips.
Guest Commentary: Successful Breakout on NZD/CHF Daily Chart
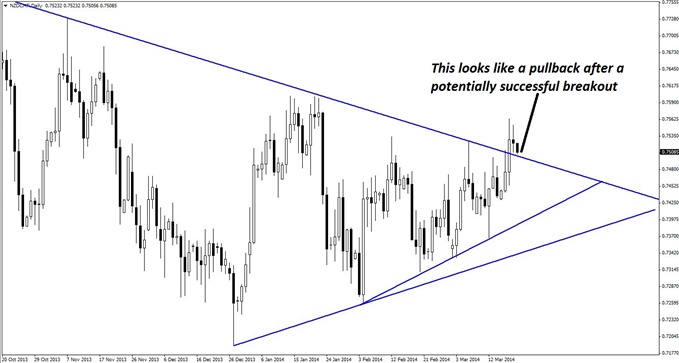
The daily chart also shows why the language of “breakout” versus “bounce” trades can be somewhat misleading, since this trade is both a breakout on the weekly chart and a potential bounce on the daily chart.
The important point to note on the four-hour chart below is that the line of resistance-turned-support where price is currently interacting was drawn on the weekly chart. This means that there may well be some "give" to it, as even a small weekly fluctuation will result in prices breaking back below this line and then running off.
Guest Commentary: A Tenuous Support Level in NZD/CHF
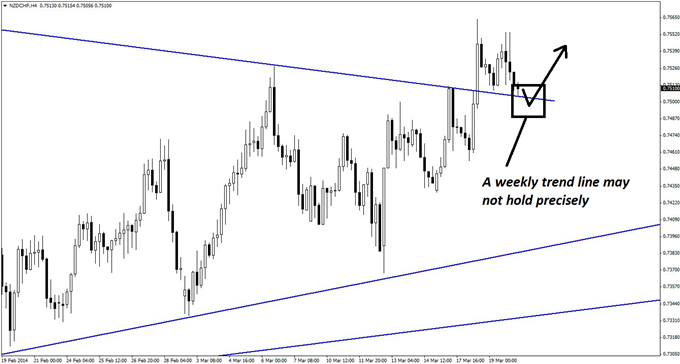
This is one of those situations that can potentially frustrate traders who try to trade the breakout, and then the false break back in, and then the second breakout. Of course, it could also just mean that prices are tumbling, but experience suggests it is better to have a “buffer,” and that’s why the support zone has been built off the below hourly chart instead.
Here, the support zone becomes more easily identifiable in relation to horizontal levels. The final support level emerges as 0.7484-0.7499, which represents a zone of risk less than 20 pips deep. That should provide excellent overall risk profile considering the weekly chart scenario that could produce a move containing hundreds of pips to the upside.
Guest Commentary: Key Zone for Initiating NZD/CHF Longs
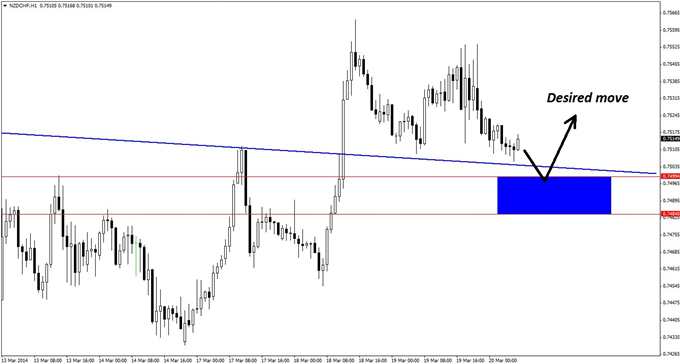
This trade is best taken on the 15-minute chart (not shown) once the key support zone is reached. Triggers on that time frame would include bullish reversal divergence, pin bars, and/or bullish engulfing patterns. As always, traders should be aware that two or three tries may be required to gain a successful entry should this move develop, and risk controls must be planned accordingly.
By Kaye Lee, private fund trader and head trader consultant, StraightTalkTrading.com
original source


