Talking Points:
- "Classic" Pullback on AUD/CHF Weekly Chart
- Potential for a False Triangle Breakout
- 3 Confluent Scenarios on the 4-Hour Chart
One of the more interesting things about trading the forex market is that even set-ups go in and out of season. Today's trade is yet another variation on the triangle pattern, which has been rather common among FX crosses in recent weeks.
Right now, there’s one occurring in AUDCHF, and even more interesting is how traders with different interpretations of the chart may end up taking the same trade.
See related: 2 Distinct Chart Scenarios, But Just One NZD/CHF Trade
The weekly chart below shows a classic pullback and also provides the first level of resistance traders may wish to consider.
Guest Commentary: Classic Pullback on AUD/CHF Weekly Chart
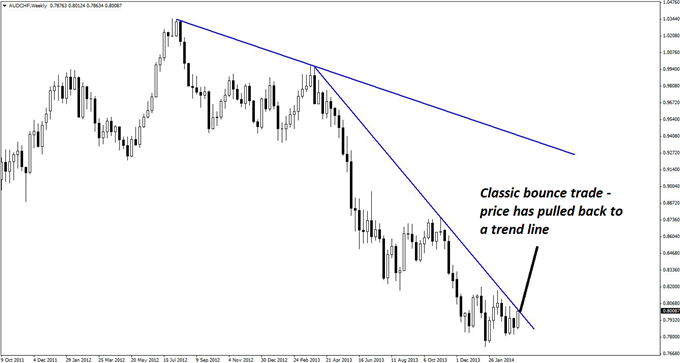
However, as many an experienced trader will have discovered, a pullback consisting of only one candlestick can be tricky to trade, and thus, it is safer to drill down to lower time frames in order to gain a more precise entry.
A breakout from the triangle on the daily chart below provides a different perspective of the same price action. AUDCHF has not yet retested the broken line of resistance, and thus, traders who suspect a false breakout may also be looking for viable short opportunities.
Guest Commentary: Tenuous Triangle on AUD/CHF Daily Chart
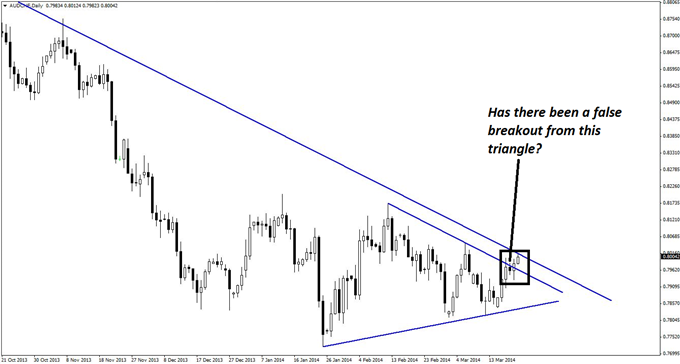
This trade could provide excellent overall risk profile if it does turn out to be a false breakout, as that would clear the way for a potential plunge and test of rising support, or even a continuation of the previous downtrend.
There are several reasons to consider the zone of resistance that has been marked by the familiar blue box on the below four-hour chart. The first is that this resistance may be due to a "flat" consolidation, as Elliott wave theorists may call it. Other traders will simply recognize a textbook range.
Guest Commentary: Key Resistance Zone for Selling AUD/CHF
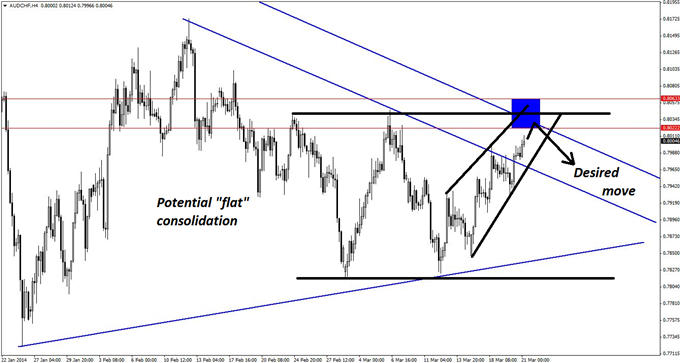
Another perspective, however, is that AUDCHF may soon form a triple top in order to continue the daily trend, although this is somewhat less convincing due to the consolidating motion prior to this pattern.
The third, and in many ways, the most convincing argument is that the rising line of resistance is due to the rising wedge pattern evident on the chart above. The wedge is composed of five waves (not shown), and fulfills Elliott wave conditions for such a formation. The most reassuring factor is that wave 4, which is the most recent pullback, slightly overlaps the top of wave 1, and that tends to signal a potential end of this upward move and a continuation of the longer-term downtrend.
In all, the resistance zone has been estimated as 0.8022-0.8063. This represents a risk area of merely 41 pips, and even a reasonable gesture towards trend continuation on the daily chart would be sufficient to make the trade worthwhile.
The ideal triggers for this trade would be found on the hourly chart (not shown) in order to utilize an even smaller stop loss. Viable triggers would include bearish reversal divergence, pin bars, and/or bearish engulfing candlesticks on the hourly chart. As always, be prepared to take two or three tries in order to hop on to this move.
By Kaye Lee, private fund trader and head trader consultant, StraightTalkTrading.com
original source


