Talking Points
- As we’ve discussed in previous Market Talks, commodities can exhibit a leading indication of future economic activity.
- The continued meltdown in commodity prices is beginning to show in corporate actions and economic data of commodity-exposed operations (companies and economies).
- While stock prices have come screaming back since October, Commodity prices and High Yield Debt has not, indicating that this story is far from over.
Traders love correlations in markets, and it’s likely because correlations present an overly-simplified way to approach a market by looking at peripherals to get an idea for what might happen down the road. One example of this is the Canadian Dollar’s correlation with Oil. Canada is a big exporter of Oil, and this provides a significant portion of the industry in the Canadian economy. As the price of Oil goes up, this means more revenue which will then lead to increased investment back into the business, including in the form of more workers. As more workers in the Canadian economy get hired by an expanding energy industry and as competition heats up for those workers, wages rise and inflation picks up.
As inflation picks up, so do expectations for higher interest rates. This means stronger swap rates for those holding that currency long at rollover (this is called the carry trade, and if you’re anywhere around markets, you want to know what it is because this can be a significant driver of capital flows). To learn more about the carry trade, and to see a pretty fantastic example, take a look at my colleague Tyler Yell’s piece from 2012, and notice the rates from the time of publishing. This is back when USD/MXN was at 12.82… now we’re at 17.32, and that’s not the only prime example.
But the direct currency correlation with Oil prices isn’t the only impact here, right? Because there is that transmission effect that will often take a few months to filter into the economy, kind of like how it takes a few months for gas prices to come down after Oil prices have fallen. Those gas stations have inventory purchased at higher prices, and they don’t want to take the hit. So they have to churn through their more expensive inventory before being able to pass on that cost savings to their customers, in much the same way that lower oil prices will wreak havoc on energy companies that are forced to react to a changing environment.
All of that beautiful synergy that we discussed earlier, in which higher oil prices lead to wider margins, which leads to more investment and more hiring, eventually bringing on inflation and higher interest rates; ya, that whole thing is dead. Commodity prices are continuing to shoot lower at a breakneck pace. We’re going in the other direction right now, and that synergy can be just as painful on the way down as it was beneficial on the way up.
As oil prices fall, margins from energy companies get squeezed; and in many cases, at least right now with oil prices having fallen so far so fast, these companies aren’t even breaking even on producing a barrel of oil. Their cost structures are based on Oil prices at $80 or $100, and these companies can ill-afford to continue producing Crude at $35 or $40 a barrel. As this happens, as these margins get squeezed and as these companies see earnings evaporate into losses, they react; and they do so by cutting back on workers or reinvestment into the business (since they have no free cash flow to reinvest anyways). This leads to higher unemployment, and less competition in the job market which leads to less growth in wages; and perhaps even a contraction in wages.
This is what is happening in emerging markets right now, and this is what is hitting Canada so incredibly hard. As Canadian companies continue to report earnings, and as the Canadian economy continues to report economic data points, we’re likely to see a continued down-trend in those prints based on the massive declines in the value of Oil, and this is yet another reason that traders are jumping over each other to sell the Canadian Dollar. Below is an overlay of Oil prices with the Canadian Dollar, and notice how over the past few weeks both of these trends have went into a parabolic-like mode:
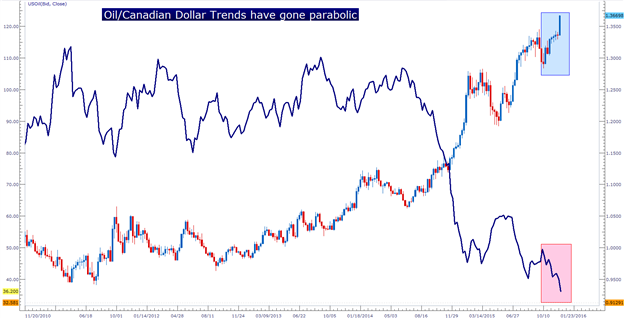
Created with Marketscope/Trading Station II; prepared by James Stanley
But currency depreciation isn’t the only concern here, is it? That’s just the initial ‘knock-on’ effect of a major commodity sell-off. Because as these companies and as these economies continue to operate at below break-even prices, they report worse performance, which leads to lower stock prices and can eventually, at some point, lead to a contraction in equities.
While there are tons of reasons for stocks to have sold off over the last six years, the one that matters most, corporate earnings, have generally remained strong. For the United States, this has been a big deal because of shale extraction and fracking. The US, over the past six years, has basically used ZIRP to completely change the face of global energy production. As rates were really low, it was advantageous for entrepreneurs to go out and borrow money while money was cheap in order to invest in Research and Development around energy extraction. This means a lot of debt was taken on to finance energy exploration and production. So, it’s not just energy companies that are exposed here, because the banks that loaned them money in the first place, whether they like it or not, are along for the ride. As these energy companies face tighter (or negative) margins and as they face a contracting, deflationary environment, there is a higher likelihood of banks not getting paid off, and this can lead to some very troubling scenarios. On the below chart, we’re looking at a High-Yield ETF that represents ‘junk bonds’ in the United States. This index has a considerable exposure to energy companies, and notice how as stocks have come back since the beginning of October, High Yield debt has not. As a matter of fact, we’ve seen a complete de-coupling of this theme as high yield debt has continued to sell-off while stock prices have continued to ascend. Investors are nervous, but the big question is which of these moves are ‘right’:
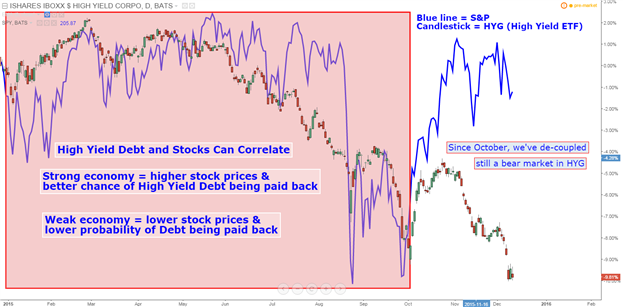
Created with Marketscope/Trading Station II; prepared by James Stanley
Over the past few weeks, we’ve begun to see the strain show with a greater degree of significance. In September, as global markets were on the edge of a major sell-off, Glencore began to conjure up images of Lehman brothers from 2007, in which one major player taking a hit infected others, creating a downward spiral that permeated global financial markets. Glencore is a commodity mining and trading company based out of Switzerland, and in the first half of this year, they reported a $676 million loss from operations on the back of those massive commodity price declines. With the large amount of debt that the company held, this created significant fear that they wouldn’t be able to pay that debt back, thereby straining the banks that had been funding them previously. This can lead to a credit collapse, because if a bank isnt’ getting paid back on such a large investment, they’ll often take on a more risk-averse approach, and this is what really decreases the velocity of money as banks duck for cover for fears of getting caught on the wrong side of a gnarly move.
But equity markets began coming back in October on the back of Central Bank support, and at least for now, Glencore has receded off of the headlines. But to be sure, this story is far from over because commodity prices haven’t stopped dropping. Earlier this week we saw another troubling turn of events as another commodity producer, Anglo American, reported that they were cutting 85,000 jobs. To give you scope on the situation, Anglo had reported losses of $3 Billion in the first half of this year, and in July, they announced plans to cut 53,000 jobs from their payrolls. But as commodity prices have continued to fall, they’ve reacted by increasing these cut backs and are now looking to ax 85,000 of their 135,000 employees. This is a reduction of 60% of their work force, and this is about as bearish of a leading indicator as there can be. The folks that run these companies are not stupid. They wouldn’t just react to a simple market move. This is a long-term deal that is going to continue to wreak havoc on commodity producers for years to come. Anglo is just a little bit ahead of the curve.
But these strains aren’t relegated to corporates, as we’ve seen dissension within OPEC as it looks like the ‘cartel’ is on the verge of breaking, and just this week South Africa’s Jacob Zuma sacked his Finance Minister, which was somewhat of a surprise, and we’ve seen the South African Rand face massive selling.
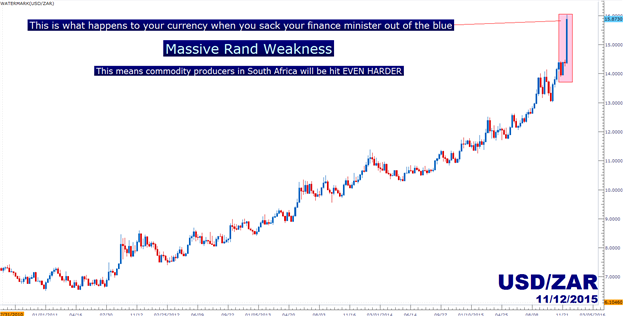
Created with Marketscope/Trading Station II; prepared by James Stanley
With the Rand selling off even more, this means that those commodity producers in South Africa are going to be hit even harder. This is not a positive for the outlook of their economy, or any emerging market really.
This is how recessions start. There is a massive credit bubble around the world driven by six years’ worth of ZIRP and low rates, not too dissimilar from the bubble in housing driven by, again, low rates, that the world saw pop in 2008. As long as things are moving along as normal, as long as prices continue to go up and markets continue to bubble, everything is ok. But once the ground begins to shake, that’s when its time to look out below. This is where we’re at right now.
As for timing – many are looking to next week’s Fed decision as being a breaking point. I urge you to utilize caution. Not only is this a widely awaited news release that can bring on all kinds of bonkers-like scenarios, but we’re at the end of the year that can often see massive positioning changes.
The contagion theme of lower commodity prices will likely take a little time to transmit through economic data. As we see future reports out of commodity producing economies or companies, we’ll see the impact of lower oil prices and we’ll see, first hand, how investors will respond. But this means that we may have to wait 3-6 months to see the damage of this commodity meltdown in earnings reports.
Below is the monthly chart of the S&P 500, and while this is still early, if we see a monthly close below 2,000 we’d have an evening star formation on this monthly chart. That can be a key bearish reversal setup for investors to look for continued declines, in which we’d essentially move back into the prior trend lower. We may have already seen the top in the S&P at 2137, and as we move into 2016, the world has an entirely new set of variables to contend with as the US hikes rates, the pain from the commodity carnage will continue to show, and as pressure continues to heat up in Asia.
We’re all in for a very interesting year.
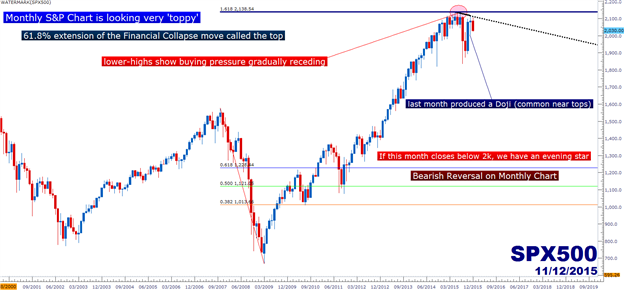
Created with Marketscope/Trading Station II; prepared by James Stanley
--- Written by James Stanley, Analyst for DailyFX.com
To receive James Stanley’s analysis directly via email, please SIGN UP HERE
Contact and follow James on Twitter: @JStanleyFX
original source


