- Third Quarter Total Revenue of
$87.5 million and Adjusted Diluted EPS of$0.45 , a decrease of 7.9% and 45.1%, respectively; - Acquisition of
Heritage Funeral Homes and Cremation Services andForest Lawn East Cemetery inCharlotte, North Carolina , and a letter of intent signed with a large business in a new strategic market; Robbie Pape joins Carriage as Senior Vice President of Operations and Regional Partner ofEastern Region .
Despite the inevitable normalizing of death rates from the elevated pandemic levels, our Company continues to broadly get better as a Being The Best Operating and Consolidation Company. And sooner rather than later, we will resume our Good To Great Journey as a
Because there are various conflicting volume, revenue and margin crosscurrents in our near-term outlook, primarily related to normalizing death rates (offset to a meaningful degree by higher revenue averages) and expected acquisition activity, we are not updating our Rolling Four Quarter Outlook in this release. However, we expect to have a much more crystalized picture of our performance outlook when we report our full year 2022 performance in late
THIRD QUARTER 2022 COMPARATIVE PERFORMANCE HIGHLIGHTS
- Total Revenue(1) of
$87.5 million , a decrease of$7.5 million or 7.9%; - Funeral GAAP Operating Income of
$17.6 million , a decrease of$5.3 million or 23.3%; - Funeral GAAP Operating Income Margin of 28.0%, a decrease of 530 basis points;
- Cemetery GAAP Operating Income of
$8.0 million , a decrease of$1.4 million or 15.3%; - Cemetery GAAP Operating Income Margin of 32.5%, a decrease of 370 basis points;
- GAAP Net Income of
$5.9 million , a decrease of$7.2 million or 55.1%; - GAAP Net Income Margin of 6.7%, a decrease of 700 basis points;
- GAAP Diluted EPS of
$0.38 , a decrease of$0.33 or 46.5%; - GAAP Cash Provided by Operating Activities of
$19.9 million , a decrease of 29.7%; - GAAP Cash Provided by Operating Activities as a percentage of Total Revenue of 22.7%, a decrease of 702 basis points;
- Funeral Same Store Contracts of 9,499, a decrease of 1,390 or 12.8%;
- Funeral Same Store Revenue of
$51.3 million , a decrease of$6.1 million or 10.6%; - Funeral Same Store EBITDA of
$18.7 million , a decrease of$6.9 million or 27.0%; - Funeral Same Store EBITDA Margin of 36.5%, a decrease of 820 basis points;
- Funeral Acquisition Revenue of
$7.8 million , an increase of$0.2 million or 2.1%; - Funeral Acquisition EBITDA of
$3.0 million , a decrease of$0.3 million or 9.9%; - Funeral Acquisition EBITDA Margin of 38.9%, a decrease of 520 basis points;
- Cemetery Same Store Revenue of
$15.4 million , a decrease of$0.9 million or 5.8%; - Cemetery Acquisition Revenue of
$5.9 million , a decrease of$0.4 million or 6.5%; - Financial Revenue of
$5.8 million , an increase of$0.2 million or 3.4%; - Total Field EBITDA of
$35.3 million , a decrease of$9.4 million or 21.0%; - Total Field EBITDA Margin of 40.3%, a decrease of 670 basis points;
- Adjusted Consolidated EBITDA of
$22.9 million , a decrease of$9.5 million or 29.4%; - Adjusted Consolidated EBITDA Margin of 26.1%, a decrease of 800 basis points;
- Adjusted Diluted EPS of
$0.45 , a decrease of$0.37 or 45.1%; - Adjusted Free Cash Flow of
$16.5 million , a decrease of$9.4 million or 36.3%; and - Adjusted Free Cash Flow Margin of 18.9%, a decrease of 840 basis points.
FIRST NINE MONTHS 2022 COMPARATIVE PERFORMANCE HIGHLIGHTS
- Total Revenue(1) of
$276.3 million , a decrease of$3.7 million or 1.3%; - Funeral GAAP Operating Income of
$61.5 million , a decrease of$3.9 million or 5.9%; - Funeral GAAP Operating Income Margin of 30.9%, a decrease of 170 basis points;
- Cemetery GAAP Operating Income of
$26.7 million , a decrease of$3.8 million or 12.5%; - Cemetery GAAP Operating Income Margin of 34.5%, a decrease of 380 basis points;
- GAAP Net Income of
$33.2 million , an increase of$13.3 million or 67.4%; - GAAP Net Income Margin of 12.0%, an increase of 490 basis points;
- GAAP Diluted EPS of
$2.09 , an increase of$1.01 or 93.5%; - GAAP Cash Provided by Operating Activities of
$50.0 million , a decrease of 28.2%; - GAAP Cash Provided by Operating Activities as a percentage of Total Revenue of 18.1%, a decrease of 678 basis points;
- Funeral Same Store Contracts of 30,686, a decrease of 817 or 2.6%;
- Funeral Same Store Revenue of
$163.8 million , a decrease of$1.7 million or 1.0%; - Funeral Same Store EBITDA of
$65.3 million , a decrease of$6.2 million or 8.7%; - Funeral Same Store EBITDA Margin of 39.9%, a decrease of 330 basis points;
- Funeral Acquisition Revenue of
$24.1 million , an increase of$1.5 million or 6.6%; - Funeral Acquisition EBITDA of
$9.8 million remained flat; - Funeral Acquisition EBITDA Margin of 40.9%, a decrease of 240 basis points;
- Cemetery Same Store Revenue of
$46.6 million , a decrease of$1.3 million or 2.6%; - Cemetery Acquisition Revenue of
$20.4 million , a decrease of$1.1 million or 5.0%; - Financial Revenue of
$17.4 million , an increase of$0.6 million or 3.4%; - Total Field EBITDA of
$119.3 million , a decrease of$11.1 million or 8.5%; - Total Field EBITDA Margin of 43.2%, a decrease of 340 basis points;
- Adjusted Consolidated EBITDA of
$80.7 million , a decrease of$15.1 million or 15.8%; - Adjusted Consolidated EBITDA Margin of 29.2%, a decrease of 500 basis points;
- Adjusted Diluted EPS of
$1.96 , a decrease of$0.31 or 13.7%; - Adjusted Free Cash Flow of
$40.9 million , a decrease of$24.5 million or 37.5%; and - Adjusted Free Cash Flow Margin of 14.8%, a decrease of 860 basis points.
(1) Total Revenue is comprised of Same Store Funeral Revenue, Acquisition Funeral Revenue, Same Store Cemetery Revenue, Acquisition Cemetery Revenue, Divested Revenue, Ancillary Revenue and Financial Revenue. The most comparable GAAP measures to the Non-GAAP measures presented in this table can be found in the Reconciliation of Non-GAAP Financial Measures section of this press release.
FIVE QUARTER TREND REPORT ENDING
| FIVE QUARTER OPERATING AND FINANCIAL TREND REPORT | ||||||||||
| (000’s except for volume, averages & margins) | 3RD QTR 2021 | 4TH QTR 2021 | 1ST QTR 2022 | 2ND QTR 2022 | 3RD QTR 2022 | |||||
| Funeral Same Store Contracts | 10,889 | 10,772 | 11,719 | 9,468 | 9,499 | |||||
| Funeral Same Store Average Revenue Per Contract (1) | ||||||||||
| Funeral Same Store Burial Contracts | 3,712 | 3,815 | 4,094 | 3,240 | 3,202 | |||||
| Funeral Same Store Burial Rate | 34.1% | 35.4% | 34.9% | 34.2% | 33.7% | |||||
| Funeral Same Store Average Revenue Per Burial Contract | ||||||||||
| Funeral Same Store Cremation Contracts | 6,230 | 6,103 | 6,679 | 5,441 | 5,530 | |||||
| Funeral Same Store Cremation Rate | 57.2% | 56.7% | 57.0% | 57.5% | 58.2% | |||||
| Funeral Same Store Average Revenue Per Cremation Contract | ||||||||||
| Funeral Same Store Revenue | ||||||||||
| Funeral Same Store EBITDA | ||||||||||
| Funeral Same Store EBITDA Margin | 44.7% | 42.5% | 44.6% | 37.5% | 36.5% | |||||
| Funeral Acquisition Revenue | ||||||||||
| Funeral Acquisition EBITDA | ||||||||||
| Funeral Acquisition EBITDA Margin | 44.1% | 44.7% | 43.6% | 40.0% | 38.9% | |||||
| Cemetery Same Store Preneed Property Contracts Sold | 1,280 | 1,120 | 1,068 | 1,228 | 1,091 | |||||
| Cemetery Same Store Preneed Sales Revenue | ||||||||||
| Cemetery Same Store Revenue | ||||||||||
| Cemetery Same Store EBITDA | ||||||||||
| Cemetery Same Store EBITDA Margin | 39.6% | 42.6% | 37.2% | 38.2% | 32.6% | |||||
| Cemetery Acquisition Preneed Property Contracts Sold | 294 | 361 | 299 | 392 | 277 | |||||
| Cemetery Acquisition Preneed Sales Revenue | ||||||||||
| Cemetery Acquisition Revenue | ||||||||||
| Cemetery Acquisition EBITDA | ||||||||||
| Cemetery Acquisition EBITDA Margin | 55.8% | 49.7% | 52.4% | 56.6% | 47.5% | |||||
| Total Financial Revenue | ||||||||||
| Total Financial EBITDA | ||||||||||
| Total Financial EBITDA Margin | 92.7% | 93.7% | 92.5% | 92.4% | 93.2% | |||||
| Total Revenue | ||||||||||
| Total Field EBITDA | ||||||||||
| Total Field EBITDA Margin | 47.0% | 46.1% | 46.3% | 42.6% | 40.3% | |||||
| Adjusted Consolidated EBITDA | ||||||||||
| Adjusted Consolidated EBITDA Margin | 34.1% | 31.7% | 33.1% | 27.9% | 26.1% | |||||
| Adjusted Diluted EPS | ||||||||||
| Adjusted Free Cash Flow | ||||||||||
| Adjusted Free Cash Flow Margin | 27.3% | 10.7% | 12.6% | 13.3% | 18.9% | |||||
| GAAP Net Income | ||||||||||
| GAAP Net Income Margin | 13.7% | 13.9% | 16.7% | 12.0% | 6.7% | |||||
| GAAP Diluted Earnings Per Share | ||||||||||
(1) Excludes Preneed Funeral interest earnings reflected in Total Financial Revenue. The most comparable GAAP measures to the Non-GAAP measures presented in this table can be found in the Reconciliation of Non-GAAP Financial Measures section of this press release.
From
The chart below demonstrates the typical seasonality of volumes on our Funeral Home Same Store Portfolio, where historically, the first quarter is the highest volume quarter, followed closely by the fourth quarter, then the second quarter, with the lowest volume in the third quarter. This seasonality prior to the pandemic has been highly correlated with past flu seasons during the winter months. The chart points out the “abnormal” seasonal peak of volumes in the third quarter of 2021, which made for an impossibly difficult comparison against a more normalized volume and seasonalized third quarter in 2022.
A chart accompanying this announcement is available at https://www.globenewswire.com/NewsRoom/AttachmentNg/36291871-8987-41bf-9fcb-6f49db3653b5
For the third quarter of 2022, Total Revenue was
Same Store Cemetery Revenue was
We experienced lower Field EBITDA Margins in the third quarter of 2022 compared to the same period in 2021, a consequence of lower volumes on higher fixed costs due to inflation, which was concentrated on full-time hourly base rate, utility, funeral supplies, and insurance. We continue to monitor these recent inflationary costs while making the necessary adjustments to keep them within reasonable historical cost ranges.
We ended the third quarter of 2022 with an Adjusted Consolidated EBITDA of
Our Adjusted Consolidated EBITDA Margins are lower than at any point since the beginning of the pandemic, which is a natural compression of margins due to inflationary costs and the negative operating leverage impact of lower revenues over higher fixed costs in many of our businesses. However, the third quarter results are NOT the new normal. We are confident the efforts to reduce the inflationary impact in each of our businesses over the next few months will improve our cost percentages against normalizing revenue. Furthermore, the Company continues to get better everyday because we have the best talent in the history of Carriage. For all these reasons and many more, we are confident that we will reach our goal of long-term sustainable ranges of Total Field EBITDA Margins of 43% - 44% and Adjusted Consolidated EBITDA Margins of 30% - 31% by 2024.
OVERHEAD INVESTMENTS UPDATE AND PROGRESS
More “A” players join
We are excited to share that
We also welcome
This powerful team supporting our
Marketing:
Our marketing team, led by
The marketing team will continue to create value organically and focus on incorporating all businesses under the marketing umbrella over time, expecting that leverage maximization will optimize marketing and advertising investments. Some examples of these include: optimized paid digital spending, leveraging a new call tracking system, increasing social media portfolio, and creating new website designs for funeral homes and cemeteries.
Information Technology:
During the first six months of Rob Franch’s tenure as the Company’s CIO, he has focused on strengthening the foundational technology across critical infrastructure and security services. Our IT transformation must begin with creating a solid and sustainable technology bedrock we expect to build further. Our IT team’s initial investments and efforts have focused on cybersecurity, connectivity, and compliance. As we further improve in these areas, we believe Carriage is well-positioned to capitalize on future digital capabilities by advancing data security, proactive threat detection, and secure connectivity to our IT systems and services.
While these investments provide excellent value to our colleagues and the families we serve, Rob intends to also look for opportunities to reduce overhead in parallel. In that respect, the IT team’s mission would include identifying and driving duplicative costs that do not align with the Company’s long-term vision and roadmap. To that end, we have set a goal to reduce overhead within IT by approximately
The Best is Yet to Come:
Great things are happening at Carriage, from the fast start High Performance marketing team, which is now hitting on all cylinders, as well as our technology-savvy future, which we expect will enable a second-to-none customer-centric experience, to our exciting growth through acquisitions. And while there is much economical and geopolitical uncertainty both globally and locally, in addition to unknown post-pandemic volume levels, we believe those levels will be above pre-pandemic levels. However, most important is that we have a Being The Best company which means that each day we become a little better than we were the day before, an effect that has a materially compounding impact over time.
We believe our Company has a bright future within the adversity-resilient death care industry, as proven by its long history. We have also learned from history that humankind will continue to honor loved ones lost and say goodbye with dignity, respect, and reverence for those no longer with us, which is why we define the noble nature of our business as high-value personal service and sales.
Our focus will continue on the things we control. At the same time, our agility and execution ability provide the foundation to ensure that regardless of the future death rate, our
STRATEGIC ACQUISITION UPDATE
We are also excited to share that we are under a letter of intent with another fantastic business in an attractive market with three funeral homes, two cemeteries, and a growing dedicated cremation business. This business, which is the leader in a large and growing strategic market in which we had no prior presence, is on pace to finish 2022 with more than
When we look at the two businesses we recently acquired in the
We will continue to focus on identifying similar businesses to support our long-term growth strategy. We never know when a premier business will be ready for a succession plan, so we always want to be sure we are well positioned to act quickly when the right opportunity is identified. To that end we have great relationships with our bank partners, led by Bank of America, and while we balance our goal of reducing leverage with being opportunistic when unique acquisition opportunities arise, we will continue to work with our banks to ensure we maintain the financial flexibility necessary to manage those priorities,” concluded
ADJUSTED FREE CASH FLOW/LEVERAGE RATIO
Our bank covenant compliance leverage ratio was 5.14 times at the end of the third quarter compared to 4.87 times at the end of the second quarter and 4.51 times at year end 2021. Total Debt was
| Three Months Ended | Nine Months Ended | |||||||||||||||
| 2021 | 2022 | 2021 | 2022 | |||||||||||||
| Cash Provided by Operating Activities | $ | 28,258 | $ | 19,869 | $ | 69,699 | $ | 50,046 | ||||||||
| Cash used for Maintenance Capital Expenditures | (4,358 | ) | (3,728 | ) | (8,960 | ) | (9,710 | ) | ||||||||
| Free Cash Flow | $ | 23,900 | $ | 16,141 | $ | 60,739 | $ | 40,336 | ||||||||
| Plus: Incremental Special Items: | ||||||||||||||||
| Severance and Separation Costs | — | 384 | 1,575 | 384 | ||||||||||||
| Disaster Recovery and Pandemic Costs | 1,002 | — | 2,041 | 168 | ||||||||||||
| Other Special Items | 1,020 | — | 1,020 | — | ||||||||||||
| Adjusted Free Cash Flow | $ | 25,922 | $ | 16,525 | $ | 65,375 | $ | 40,888 | ||||||||
| Total Revenue | $ | 95,041 | $ | 87,497 | $ | 279,955 | $ | 276,258 | ||||||||
| Adjusted Free Cash Flow Margin | 27.3% | 18.9% | 23.4% | 14.8% | ||||||||||||
Third quarter Adjusted Free Cash Flow declined
Adjusted Free Cash Flow for the nine months ending
The Adjusted Free Cash Flow Margin represents the amount of cash generated for every dollar of Revenue that is available for shareholder value creation capital allocation through debt paydown or by acquisition of high-quality funeral homes and cemeteries. We believe it is an important metric for investors to gauge the recurring nature of the Free Cash Flow earnings power of Carriage.
TRUST FUND INVESTMENT PERFORMANCE
| YTD 2022 | Annualized 2009 - Q3 2022 | |||
| CSV Discretionary Portfolio | (8.5)% | 12.8% | ||
| S&P 500 | (23.9)% | 12.8% | ||
| DJIA | (19.7)% | 11.7% | ||
| NASDAQ | (32.0)% | 16.1% | ||
| HY Bond Index | (14.7)% | 8.7% | ||
| 70/30 HY/S&P Bond | (17.5)% | 10.1% | ||
Through the third quarter, our year-to-date return for our discretionary trust portfolio was negative 8.5% versus negative 23.9% for the S&P 500 and negative 17.5% for our 70/30 HY Bond/S&P 500 benchmark. For the last twelve months our total return for our discretionary trust portfolio was negative 4.1% compared to negative 15.5% for the S&P 500 and negative 14.5% for our 70/30 HY Bond/S&P 500 benchmark.
The third quarter marked a continued relative outperformance for our discretionary preneed trust funds compared to the broader market in an environment of geopolitical instability, persistent inflation, a historically rapid rise in interest rates and significant shifts in currency valuations across the world that have led to year-to-date historical declines in both the equity and fixed income markets. The relative outperformance has allowed us to position the discretionary trust fund portfolio to have the flexibility to deploy additional capital in potentially weaker or more volatile markets while being able to continue to generate a high amount of recurring investment income in the portfolio, which has grown to approximately
As of last
One of the many attractive characteristics of the acquisitions being announced is that they have significant trust funds that once integrated into our pooled partnership framework should produce another step up in our reported Financial Revenue and EBITDA in future years. This high amount of recurring income generated in the portfolio combined with the approximately
CONFERENCE CALL AND INVESTOR RELATIONS CONTACT
| OPERATING AND FINANCIAL TREND REPORT | |||||||||||||||||||
| (IN THOUSANDS - EXCEPT PER SHARE AMOUNTS) | |||||||||||||||||||
| Three Months Ended | Nine Months Ended | ||||||||||||||||||
| 2021 | 2022 | % Change | 2021 | 2022 | % Change | ||||||||||||||
| Same Store Contracts | |||||||||||||||||||
| Atneed Contracts | 9,341 | 8,029 | (14.0 | %) | 26,829 | 26,073 | (2.8 | %) | |||||||||||
| Preneed Contracts | 1,548 | 1,470 | (5.0 | %) | 4,674 | 4,613 | (1.3 | %) | |||||||||||
| Total Same Store Funeral Contracts | 10,889 | 9,499 | (12.8 | %) | 31,503 | 30,686 | (2.6 | %) | |||||||||||
| Acquisition Contracts | |||||||||||||||||||
| Atneed Contracts | 1,445 | 1,403 | (2.9 | %) | 4,408 | 4,254 | (3.5 | %) | |||||||||||
| Preneed Contracts | 110 | 167 | 51.8 | % | 341 | 511 | 49.9 | % | |||||||||||
| Total Acquisition Funeral Contracts | 1,555 | 1,570 | 1.0 | % | 4,749 | 4,765 | 0.3 | % | |||||||||||
| Total Funeral Contracts | 12,444 | 11,069 | (11.0 | %) | 36,252 | 35,451 | (2.2 | %) | |||||||||||
| Funeral Operating Revenue | |||||||||||||||||||
| Same Store Revenue | $ | 57,321 | $ | 51,258 | (10.6 | %) | $ | 165,481 | $ | 163,776 | (1.0 | %) | |||||||
| Acquisition Revenue | 7,651 | 7,813 | 2.1 | % | 22,575 | 24,064 | 6.6 | % | |||||||||||
| Total Funeral Operating Revenue | $ | 64,972 | $ | 59,071 | (9.1 | %) | $ | 188,056 | $ | 187,840 | (0.1 | %) | |||||||
| Cemetery Operating Revenue | |||||||||||||||||||
| Same Store Revenue | $ | 16,342 | $ | 15,396 | (5.8 | %) | $ | 47,883 | $ | 46,616 | (2.6 | %) | |||||||
| Acquisition Revenue | 6,362 | 5,947 | (6.5 | %) | 21,517 | 20,437 | (5.0 | %) | |||||||||||
| Total Cemetery Operating Revenue | $ | 22,704 | $ | 21,343 | (6.0 | %) | $ | 69,400 | $ | 67,053 | (3.4 | %) | |||||||
| Total Financial Revenue | $ | 5,653 | $ | 5,848 | 3.4 | % | $ | 16,786 | $ | 17,359 | 3.4 | % | |||||||
| Ancillary Revenue | $ | 1,096 | $ | 1,049 | (4.3 | %) | $ | 3,391 | $ | 3,099 | (8.6 | %) | |||||||
| Total Divested/Planned Divested Revenue | $ | 616 | $ | 186 | (69.8 | %) | $ | 2,322 | $ | 907 | (60.9 | %) | |||||||
| Total Revenue | $ | 95,041 | $ | 87,497 | (7.9 | %) | $ | 279,955 | $ | 276,258 | (1.3 | %) | |||||||
| Field EBITDA | |||||||||||||||||||
| Same Store Funeral Field EBITDA | $ | 25,644 | $ | 18,717 | (27.0 | %) | $ | 71,520 | $ | 65,313 | (8.7 | %) | |||||||
| Same Store Funeral Field EBITDA Margin | 44.7 | % | 36.5 | % | (820 bp) | 43.2 | % | 39.9 | % | (330 bp) | |||||||||
| Acquisition Funeral Field EBITDA | 3,371 | 3,036 | (9.9 | %) | 9,784 | 9,845 | 0.6 | % | |||||||||||
| Acquisition Funeral Field EBITDA Margin | 44.1 | % | 38.9 | % | (520 bp) | 43.3 | % | 40.9 | % | (240 bp) | |||||||||
| Total Funeral Field EBITDA | $ | 29,015 | $ | 21,753 | (25.0 | %) | $ | 81,304 | $ | 75,158 | (7.6 | %) | |||||||
| Total Funeral Field EBITDA Margin | 44.7 | % | 36.8 | % | (790 bp) | 43.2 | % | 40.0 | % | (320 bp) | |||||||||
| Same Store Cemetery Field EBITDA | $ | 6,465 | $ | 5,020 | (22.4 | %) | $ | 20,076 | $ | 16,799 | (16.3 | %) | |||||||
| Same Store Cemetery Field EBITDA Margin | 39.6 | % | 32.6 | % | (700 bp) | 41.9 | % | 36.0 | % | (590 bp) | |||||||||
| Acquisition Cemetery Field EBITDA | 3,547 | 2,827 | (20.3 | %) | 12,386 | 10,766 | (13.1 | %) | |||||||||||
| Acquisition Cemetery Field EBITDA Margin | 55.8 | % | 47.5 | % | (830 bp) | 57.6 | % | 52.7 | % | (490 bp) | |||||||||
| Total Cemetery Field EBITDA | $ | 10,012 | $ | 7,847 | (21.6 | %) | $ | 32,462 | $ | 27,565 | (15.1 | %) | |||||||
| Total Cemetery Field EBITDA Margin | 44.1 | % | 36.8 | % | (730 bp) | 46.8 | % | 41.1 | % | (570 bp) | |||||||||
| Total Financial Field EBITDA | $ | 5,239 | $ | 5,449 | 4.0 | % | $ | 15,625 | $ | 16,091 | 3.0 | % | |||||||
| Total Financial Field EBITDA Margin | 92.7 | % | 93.2 | % | 50 bp | 93.1 | % | 92.7 | % | (40 bp) | |||||||||
| Ancillary EBITDA | $ | 274 | $ | 188 | (31.4 | %) | $ | 790 | $ | 560 | (29.1 | %) | |||||||
| Ancillary EBITDA Margin | 25.0 | % | 17.9 | % | (710 bp) | 23.3 | % | 18.1 | % | (520 bp) | |||||||||
| Total Divested/Planned Divested EBITDA | $ | 111 | $ | 16 | (85.6 | %) | $ | 271 | $ | (32 | ) | (111.8 | %) | ||||||
| Total Divested/Planned Divested EBITDA Margin | 18.0 | % | 8.6 | % | (940 bp) | 11.7 | % | (3.5 | )% | (1,520 bp) | |||||||||
| Total Field EBITDA | $ | 44,651 | $ | 35,253 | (21.0 | %) | $ | 130,452 | $ | 119,342 | (8.5 | %) | |||||||
| Total Field EBITDA Margin | 47.0 | % | 40.3 | % | (670 bp) | 46.6 | % | 43.2 | % | (340 bp) | |||||||||
| OPERATING AND FINANCIAL TREND REPORT | |||||||||||||||||||
| (IN THOUSANDS - EXCEPT PER SHARE AMOUNTS) | |||||||||||||||||||
| Three Months Ended | Nine Months Ended | ||||||||||||||||||
| 2021 | 2022 | % Change | 2021 | 2022 | % Change | ||||||||||||||
| Overhead | |||||||||||||||||||
| Total Variable Overhead | $ | 7,103 | $ | 5,627 | (20.8 | %) | $ | 18,548 | $ | 15,322 | (17.4 | %) | |||||||
| Total Regional Fixed Overhead | 1,326 | 1,159 | (12.6 | %) | 3,881 | 4,094 | 5.5 | % | |||||||||||
| Total Corporate Fixed Overhead | 5,855 | 7,043 | 20.3 | % | 16,893 | 21,072 | 24.7 | % | |||||||||||
| Total Overhead | $ | 14,284 | $ | 13,829 | (3.2 | %) | $ | 39,322 | $ | 40,488 | 3.0 | % | |||||||
| Overhead as a percentage of Revenue | 15.0 | % | 15.8 | % | 80 bp | 14.0 | % | 14.7 | % | 70 bp | |||||||||
| Consolidated EBITDA | $ | 30,367 | $ | 21,424 | (29.4 | %) | $ | 91,130 | $ | 78,854 | (13.5 | %) | |||||||
| Consolidated EBITDA Margin | 32.0 | % | 24.5 | % | (750 bp) | 32.6 | % | 28.5 | % | (410 bp) | |||||||||
| Other Expenses and Interest | |||||||||||||||||||
| Depreciation & Amortization | $ | 4,950 | $ | 4,716 | $ | 15,486 | $ | 14,611 | |||||||||||
| Non-Cash Stock Compensation | 1,294 | 1,493 | 3,832 | 4,578 | |||||||||||||||
| Interest Expense | 5,076 | 6,678 | 20,138 | 18,208 | |||||||||||||||
| Accretion on Convertible Sub. Notes | — | — | 20 | — | |||||||||||||||
| Loss on Extinguishment of Debt | — | — | 23,807 | — | |||||||||||||||
| Net (Gain) Loss on Divestitures | 282 | — | 179 | (575 | ) | ||||||||||||||
| Impairment of | 500 | — | 500 | — | |||||||||||||||
| — | — | — | (3,275 | ) | |||||||||||||||
| Net Loss on Disposal of Fixed Assets | 76 | (7 | ) | 698 | 142 | ||||||||||||||
| Other, Net | 21 | (95 | ) | 87 | (78 | ) | |||||||||||||
| Pre-Tax Income | $ | 18,168 | $ | 8,639 | $ | 26,383 | $ | 45,243 | |||||||||||
| Net Tax Expense | 5,122 | 2,779 | 6,571 | 12,082 | |||||||||||||||
| GAAP Net Income | $ | 13,046 | $ | 5,860 | (55.1 | %) | $ | 19,812 | $ | 33,161 | 67.4 | % | |||||||
| Special Items | |||||||||||||||||||
| Severance and Separation Costs | — | 1,431 | 1,575 | 1,431 | |||||||||||||||
| Accretion on Convertible Sub. Notes | — | — | 20 | — | |||||||||||||||
| Net (Gain) Loss on Divestitures | 282 | — | 179 | (575 | ) | ||||||||||||||
| Impairment of | 500 | — | 500 | — | |||||||||||||||
| Litigation Reserve | — | — | — | 200 | |||||||||||||||
| Loss on Extinguishment of Debt | — | — | 23,807 | — | |||||||||||||||
| — | — | — | (3,275 | ) | |||||||||||||||
| Disaster Recovery and Pandemic Costs | 1,002 | — | 2,041 | 168 | |||||||||||||||
| Change in Uncertain Tax Reserves | — | — | — | (533 | ) | ||||||||||||||
| Other Special Items | 1,020 | — | 2,354 | — | |||||||||||||||
| Sum of Special Items | $ | 2,804 | $ | 1,431 | $ | 30,476 | $ | (2,584 | ) | ||||||||||
| Tax Effect on Special Items | 738 | 356 | 8,619 | (570 | ) | ||||||||||||||
| Adjusted Net Income | $ | 15,112 | $ | 6,935 | (54.1 | %) | $ | 41,669 | $ | 31,147 | (25.3 | %) | |||||||
| Adjusted Net Income Margin | 15.9 | % | 7.9 | % | (800 bp) | 14.9 | % | 11.3 | % | (360 bp) | |||||||||
| Adjusted Basic Earnings Per Share | $ | 0.86 | $ | 0.47 | (45.3 | %) | $ | 2.34 | $ | 2.08 | (11.1 | %) | |||||||
| Adjusted Diluted Earnings Per Share | $ | 0.82 | $ | 0.45 | (45.1 | %) | $ | 2.27 | $ | 1.96 | (13.7 | %) | |||||||
| GAAP Basic Earnings Per Share | $ | 0.74 | $ | 0.40 | (45.9 | %) | $ | 1.11 | $ | 2.22 | 100.0 | % | |||||||
| GAAP Diluted Earnings Per Share | $ | 0.71 | $ | 0.38 | (46.5 | %) | $ | 1.08 | $ | 2.09 | 93.5 | % | |||||||
| Weighted Average Shares o/s - Basic | 17,499 | 14,689 | 17,809 | 14,908 | |||||||||||||||
| Weighted Average Shares o/s - Diluted | 18,246 | 15,537 | 18,365 | 15,849 | |||||||||||||||
| Reconciliation to Adjusted Consolidated EBITDA | |||||||||||||||||||
| Consolidated EBITDA | $ | 30,367 | $ | 21,424 | (29.4 | %) | $ | 91,130 | $ | 78,854 | (13.5 | %) | |||||||
| Severance and Separation Costs | — | 1,431 | 1,575 | 1,431 | |||||||||||||||
| Litigation Reserve | — | — | — | 200 | |||||||||||||||
| Disaster Recovery and Pandemic Costs | 1,002 | — | 2,041 | 168 | |||||||||||||||
| Other Special Items | 1,020 | — | 1,020 | — | |||||||||||||||
| Adjusted Consolidated EBITDA | $ | 32,389 | $ | 22,855 | (29.4 | %) | $ | 95,766 | $ | 80,653 | (15.8 | %) | |||||||
| Adjusted Consolidated EBITDA Margin | 34.1 | % | 26.1 | % | (800 bp) | 34.2 | 29.2 | (500 bp) | |||||||||||
| CONDENSED CONSOLIDATED BALANCE SHEET | |||||||
| (unaudited and in thousands) | |||||||
| ASSETS | |||||||
| Current assets: | |||||||
| Cash and cash equivalents | $ | 1,148 | $ | 821 | |||
| Accounts receivable, net | 25,314 | 23,352 | |||||
| Inventories | 7,346 | 7,675 | |||||
| Prepaid and other current assets | 6,404 | 4,131 | |||||
| Total current assets | 40,212 | 35,979 | |||||
| Preneed cemetery trust investments | 100,903 | 87,030 | |||||
| Preneed funeral trust investments | 113,658 | 98,638 | |||||
| Preneed cemetery receivables, net | 23,150 | 25,873 | |||||
| Receivables from funeral preneed trusts, net | 19,009 | 20,119 | |||||
| Property, plant and equipment, net | 269,367 | 275,977 | |||||
| Cemetery property, net | 100,701 | 101,691 | |||||
| 391,972 | 393,765 | ||||||
| Intangible and other non-current assets, net | 29,378 | 30,451 | |||||
| Operating lease right-of-use assets | 17,881 | 17,295 | |||||
| Cemetery perpetual care trust investments | 72,400 | 60,569 | |||||
| Total assets | $ | 1,178,631 | $ | 1,147,387 | |||
| LIABILITIES AND STOCKHOLDERS’ EQUITY | |||||||
| Current liabilities: | |||||||
| Current portion of debt and lease obligations | $ | 2,809 | $ | 3,104 | |||
| Accounts payable | 14,205 | 9,325 | |||||
| Accrued and other liabilities | 43,773 | 37,123 | |||||
| Total current liabilities | 60,787 | 49,552 | |||||
| Acquisition debt, net of current portion | 3,979 | 3,846 | |||||
| Credit facility | 153,857 | 167,410 | |||||
| Senior notes | 394,610 | 395,082 | |||||
| Obligations under finance leases, net of current portion | 5,157 | 4,842 | |||||
| Obligations under operating leases, net of current portion | 18,520 | 17,638 | |||||
| Deferred preneed cemetery revenue | 50,202 | 52,173 | |||||
| Deferred preneed funeral revenue | 30,584 | 32,006 | |||||
| Deferred tax liability | 45,784 | 47,483 | |||||
| Other long-term liabilities | 1,419 | 2,700 | |||||
| Deferred preneed cemetery receipts held in trust | 100,903 | 87,030 | |||||
| Deferred preneed funeral receipts held in trust | 113,658 | 98,638 | |||||
| Care trusts’ corpus | 71,156 | 60,067 | |||||
| Total liabilities | 1,050,616 | 1,018,467 | |||||
| Commitments and contingencies: | |||||||
| Stockholders’ equity: | |||||||
| Common stock | 263 | 263 | |||||
| Additional paid-in capital | 236,809 | 238,787 | |||||
| Retained earnings | 135,462 | 168,623 | |||||
| (244,519 | ) | (278,753 | ) | ||||
| Total stockholders’ equity | 128,015 | 128,920 | |||||
| Total liabilities and stockholders’ equity | $ | 1,178,631 | $ | 1,147,387 | |||
| CONSOLIDATED STATEMENTS OF OPERATIONS | |||||||||||||||
| (unaudited and in thousands, except per share data) | |||||||||||||||
| Three Months Ended | Nine Months Ended | ||||||||||||||
| 2021 | 2022 | 2021 | 2022 | ||||||||||||
| Revenue: | |||||||||||||||
| Service revenue | $ | 46,210 | $ | 42,992 | $ | 134,086 | $ | 135,279 | |||||||
| Property and merchandise revenue | 42,043 | 37,607 | 125,545 | 120,495 | |||||||||||
| Other revenue | 6,788 | 6,898 | 20,324 | 20,484 | |||||||||||
| 95,041 | 87,497 | 279,955 | 276,258 | ||||||||||||
| Field costs and expenses: | |||||||||||||||
| Cost of service | 20,523 | 22,317 | 61,073 | 65,805 | |||||||||||
| Cost of merchandise | 28,632 | 28,668 | 84,672 | 87,304 | |||||||||||
| Cemetery property amortization | 1,521 | 1,278 | 5,213 | 4,314 | |||||||||||
| Field depreciation expense | 3,154 | 3,281 | 9,432 | 9,831 | |||||||||||
| Regional and unallocated funeral and cemetery costs | 6,812 | 5,096 | 18,655 | 17,409 | |||||||||||
| Other expenses | 1,235 | 1,259 | 3,758 | 3,807 | |||||||||||
| 61,877 | 61,899 | 182,803 | 188,470 | ||||||||||||
| Gross profit | 33,164 | 25,598 | 97,152 | 87,788 | |||||||||||
| Corporate costs and expenses: | |||||||||||||||
| General, administrative and other | 9,041 | 10,383 | 25,340 | 28,123 | |||||||||||
| Net (gain) loss on divestitures, disposals and impairment charges | 858 | (7 | ) | 1,377 | (433 | ) | |||||||||
| Operating income | 23,265 | 15,222 | 70,435 | 60,098 | |||||||||||
| Interest expense | (5,076 | ) | (6,678 | ) | (20,138 | ) | (18,208 | ) | |||||||
| Accretion of discount on convertible subordinated notes | — | — | (20 | ) | — | ||||||||||
| Loss on extinguishment of debt | — | — | (23,807 | ) | — | ||||||||||
| Gain on insurance reimbursements | — | — | — | 3,275 | |||||||||||
| Other, net | (21 | ) | 95 | (87 | ) | 78 | |||||||||
| Income before income taxes | 18,168 | 8,639 | 26,383 | 45,243 | |||||||||||
| Expense for income taxes | (5,125 | ) | (2,640 | ) | (7,466 | ) | (12,578 | ) | |||||||
| Tax adjustment related to certain discrete items | 3 | (139 | ) | 895 | 496 | ||||||||||
| Total expense for income taxes | (5,122 | ) | (2,779 | ) | (6,571 | ) | (12,082 | ) | |||||||
| Net income | $ | 13,046 | $ | 5,860 | $ | 19,812 | $ | 33,161 | |||||||
| Basic earnings per common share: | $ | 0.74 | $ | 0.40 | $ | 1.11 | $ | 2.22 | |||||||
| Diluted earnings per common share: | $ | 0.71 | $ | 0.38 | $ | 1.08 | $ | 2.09 | |||||||
| Dividends declared per common share: | $ | 0.1000 | $ | 0.1125 | $ | 0.3000 | $ | 0.3375 | |||||||
| Weighted average number of common and common equivalent shares outstanding: | |||||||||||||||
| Basic | 17,499 | 14,689 | 17,809 | 14,908 | |||||||||||
| Diluted | 18,246 | 15,537 | 18,365 | 15,849 | |||||||||||
| CONSOLIDATED STATEMENTS OF CASH FLOWS | |||||||
| (unaudited and in thousands) | |||||||
| Nine Months Ended | |||||||
| 2021 | 2022 | ||||||
| Cash flows from operating activities: | |||||||
| Net income | $ | 19,812 | $ | 33,161 | |||
| Adjustments to reconcile net income to net cash provided by operating activities: | |||||||
| Depreciation and amortization | 15,486 | 14,611 | |||||
| Provision for credit losses | 1,426 | 2,292 | |||||
| Stock-based compensation expense | 3,832 | 4,577 | |||||
| Deferred income tax expense (benefit) | (3,433 | ) | 1,699 | ||||
| Amortization of intangibles | 968 | 957 | |||||
| Amortization of debt issuance costs | 459 | 397 | |||||
| Amortization and accretion of debt | 319 | 368 | |||||
| Loss on extinguishment of debt | 23,807 | — | |||||
| Net (gain) loss on divestitures, disposals and impairment charges | 1,558 | (433 | ) | ||||
| Gain on insurance reimbursements | — | (3,275 | ) | ||||
| Other | — | (153 | ) | ||||
| Changes in operating assets and liabilities that provided (used) cash: | |||||||
| Accounts and preneed receivables | (4,387 | ) | (3,053 | ) | |||
| Inventories, prepaid and other current assets | (266 | ) | 2,785 | ||||
| Intangible and other non-current assets | (887 | ) | (1,381 | ) | |||
| Preneed funeral and cemetery trust investments | (23,355 | ) | (12,585 | ) | |||
| Accounts payable | (845 | ) | (2,451 | ) | |||
| Accrued and other liabilities | 9,643 | (3,080 | ) | ||||
| Deferred preneed funeral and cemetery revenue | 3,587 | 2,852 | |||||
| Deferred preneed funeral and cemetery receipts held in trust | 21,975 | 12,758 | |||||
| Net cash provided by operating activities | 69,699 | 50,046 | |||||
| Cash flows from investing activities: | |||||||
| Acquisitions of businesses and real estate | (3,285 | ) | (8,876 | ) | |||
| Proceeds from divestitures and sale of other assets | 4,375 | 4,313 | |||||
| Proceeds from insurance reimbursements | 2,946 | 2,209 | |||||
| Capital expenditures | (15,252 | ) | (20,346 | ) | |||
| Net cash used in investing activities | (11,216 | ) | (22,700 | ) | |||
| Cash flows from financing activities: | |||||||
| Borrowings from the credit facility | 154,968 | 114,600 | |||||
| Payments against the credit facility | (115,268 | ) | (101,000 | ) | |||
| Payment to redeem the senior notes due 2026 | (400,000 | ) | — | ||||
| Payment of call premium for the redemption of the senior notes due 2026 | (19,876 | ) | — | ||||
| Proceeds from the issuance of the senior notes due 2029 | 395,500 | — | |||||
| Payment of debt issuance costs for the credit facility and senior notes due 2029 | (2,054 | ) | (339 | ) | |||
| Conversions and maturity of the convertible notes | (3,980 | ) | — | ||||
| Payments on acquisition debt and obligations under finance leases | (658 | ) | (314 | ) | |||
| Payments on contingent consideration recorded at acquisition date | (461 | ) | — | ||||
| Proceeds from the exercise of stock options and employee stock purchase plan contributions | 2,107 | 1,438 | |||||
| Taxes paid on restricted stock vestings and exercises of stock options | (1,433 | ) | (287 | ) | |||
| Dividends paid on common stock | (5,390 | ) | (5,108 | ) | |||
| Purchase of treasury stock | (61,739 | ) | (36,663 | ) | |||
| Net cash used in financing activities | (58,284 | ) | (27,673 | ) | |||
| Net increase (decrease) in cash and cash equivalents | 199 | (327 | ) | ||||
| Cash and cash equivalents at beginning of period | 889 | 1,148 | |||||
| Cash and cash equivalents at end of period | $ | 1,088 | $ | 821 | |||
NON-GAAP FINANCIAL MEASURES
This press release uses Non-GAAP financial measures to present the financial performance of the Company. Our Non-GAAP reporting provides a transparent framework of our operating and financial performance that reflects the earning power of the Company as an operating and consolidation platform.
Non-GAAP financial measures should be viewed in addition to, and not as an alternative for, the Company’s reported operating results or cash flow from operations or any other measure of performance as determined in accordance with GAAP. We believe the Non-GAAP results are useful to investors to compare our results to previous periods, to provide insight into the underlying long-term performance trends in our business and to provide the opportunity to differentiate ourselves as the best consolidation platform in the industry against the performance of other funeral and cemetery companies.
Reconciliations of the Non-GAAP financial measures to GAAP measures are also provided in this press release.
The term “same store” refers to funeral homes and cemeteries acquired prior to
The Non-GAAP financial measures used in this press release and the definitions of them used by the Company for our internal management purposes in this press release are described below.
- Special Items are defined as charges or credits included in our GAAP financial statements that can vary from period to period and are not reflective of costs incurred in the ordinary course of our operations. The Change in Uncertain Tax Reserves and Other was not tax effected. Special Items were taxed at the operating tax rate.
- Adjusted Net Income is defined as net income after adjustments for Special Items that we believe do not directly reflect our core operations and may not be indicative of our normal business operations.
- Adjusted Net Income Margin is defined as Adjusted Net Income as a percentage of total revenue.
- Consolidated EBITDA is defined as net income before income taxes, interest expenses, non-cash stock compensation, depreciation and amortization, and interest income and other, net.
- Consolidated EBITDA Margin is defined as Consolidated EBITDA as a percentage of total revenue.
- Adjusted Consolidated EBITDA is defined as Consolidated EBITDA after adjustments for Special Items that we believe do not directly reflect our core operations and may not be indicative of our normal business operations.
- Adjusted Consolidated EBITDA Margin is defined as Adjusted Consolidated EBITDA as a percentage of total revenue.
- Adjusted Free Cash Flow is defined as net cash provided by operating activities, adjusted by Special Items as deemed necessary, less cash for maintenance capital expenditures.
- Adjusted Free Cash Flow Margin is defined as Adjusted Free Cash Flow as a percentage of total revenue.
- Funeral Field EBITDA is defined as funeral operating income, excluding depreciation and amortization, regional and unallocated costs, gain/loss on divestitures and fixed assets and impairment charges, Financial Field EBITDA, Ancillary EBITDA and Divested/Planned Divested EBITDA related to the Funeral Home segment.
- Funeral Field EBITDA Margin is defined as Funeral Field EBITDA as a percentage of total funeral operating revenue.
- Cemetery Field EBITDA is defined as cemetery operating income, excluding depreciation and amortization, regional and unallocated costs, gain/loss on divestitures and fixed assets and impairment charges, Financial Field EBITDA and Divested/Planned Divested EBITDA related to the Cemetery segment.
- Cemetery Field EBITDA Margin is defined as Cemetery Field EBITDA as a percentage of total cemetery operating revenue.
- Preneed Cemetery Property Sales is defined as cemetery property sold prior to death.
- Total Preneed Cemetery Sales Production is defined as all cemetery property, merchandise and services sold prior to death.
- Funeral Financial Field EBITDA is defined as Funeral Financial Revenue (preneed funeral insurance commissions and preneed funeral trust and insurance) less the related expenses. Funeral Financial Revenue and the related expenses are presented within Other Revenue and Other Expenses, respectively, on the Consolidated Statement of Operations.
- Funeral Financial Field EBITDA Margin is defined as Funeral Financial Field EBITDA as a percentage of Funeral Financial Revenue.
- Cemetery Financial Field EBITDA is defined as Cemetery Financial Revenue (preneed cemetery trust earnings and preneed cemetery finance charges) less the related expenses. Cemetery Financial Revenue and the related expenses are presented within Other Revenue and Other Expenses, respectively, on the Consolidated Statement of Operations.
- Cemetery Financial Field EBITDA Margin is defined as Cemetery Financial Field EBITDA as a percentage of Cemetery Financial Revenue.
- Total Financial Revenue is the sum of Funeral Financial Revenue (preneed funeral insurance commissions and preneed funeral trust and insurance) and Cemetery Financial Revenue (preneed cemetery trust earnings and preneed cemetery finance charges).
- Total Financial Field EBITDA is the sum of Funeral Financial Field EBITDA and Cemetery Financial Field EBITDA.
- Total Financial Field EBITDA Margin is defined as Total Financial Field EBITDA as a percentage of Total Financial Revenue.
- Ancillary Revenue is defined as revenues from our ancillary businesses, which include a flower shop, pet cremation business and online cremation business. Ancillary Revenue and the related expenses are presented within Other Revenue and Other Expenses, respectively, on the Consolidated Statement of Operations.
- Ancillary EBITDA is defined as Ancillary Revenue, less expenses related to our ancillary businesses noted above.
- Ancillary EBITDA Margin is defined as Ancillary EBITDA as a percentage of Ancillary Revenue.
- Divested/Planned Divested Revenue is defined as revenues from certain funeral home and cemetery businesses that we have divested and intend to divest.
- Divested/Planned Divested EBITDA is defined as Divested/Planned Divested Revenue, less field level and financial expenses related to the divested/planned divested businesses noted above.
- Divested/Planned Divested EBITDA Margin is defined as Divested/Planned Divested EBITDA as a percentage of Divested/Planned Divested Revenue.
- Total Field EBITDA is the sum of Funeral Field EBITDA, Cemetery Field EBITDA, Total Financial Field EBITDA, Ancillary EBITDA and Divested/Planned Divested EBITDA.
- Total Field EBITDA Margin is defined as Total Field EBITDA as a percentage of total revenue.
- Adjusted Basic Earnings Per Share (EPS) is defined as GAAP basic earnings per share, adjusted for Special Items.
- Adjusted Diluted Earnings Per Share (EPS) is defined as GAAP diluted earnings per share, adjusted for Special Items.
- Total Debt Outstanding is defined as indebtedness under our senior notes due 2029, acquisition debt, finance leases and bank credit facility, including our letter of credit.
- Proforma Trailing Twelve Months of Adjusted Consolidated EBITDA is defined as trailing twelve months of Adjusted Consolidated EBITDA including proforma EBITDA for our
August 2022 acquisition, as well as add backs for deferred purchase price payments made during the last twelve months. - Bank Covenant Compliance Leverage Ratio is defined as Total Debt Outstanding to Proforma Trailing Twelve Months of Adjusted Consolidated EBITDA.
Funeral Field EBITDA and Cemetery Field EBITDA
Our operations are reported in two business segments: Funeral Home Operations and Cemetery Operations. Our Field level results highlight trends in volumes, Revenue, Field EBITDA (the individual business’ cash earning power/locally controllable business profit) and Field EBITDA Margin (the individual business’ controllable profit margin).
Funeral Field EBITDA and Cemetery Field EBITDA are defined above. Funeral and Cemetery Operating Income is defined as Revenue less “Field costs and expenses” — a line item encompassing these areas of costs: i) Funeral and cemetery field costs, ii) Field depreciation and amortization expense, iii) Regional and unallocated funeral and cemetery costs, and iv) Gain/loss on divestitures, disposals and impairment charges. Funeral and cemetery field costs include cost of service, funeral and cemetery merchandise costs, operating expenses, labor and other related expenses incurred at the business level.
Regional and unallocated funeral and cemetery costs presented in our GAAP statement consist primarily of salaries and benefits of our Regional leadership, incentive compensation opportunity to our Field employees and other related costs for field infrastructure. These costs, while necessary to operate our businesses as currently operated within our unique, decentralized platform, are not controllable operating expenses at the Field level as the composition, structure and function of these costs are determined by executive leadership in the Houston Support Center. These costs are components of our overall overhead platform presented within Consolidated EBITDA and Adjusted Consolidated EBITDA. We do not directly or indirectly “push down” any of these expenses to the individual business’ field level margins.
We believe that our “Regional and unallocated funeral and cemetery costs” are necessary to support our decentralized, high performance culture operating framework, and as such, are included in Consolidated EBITDA and Adjusted Consolidated EBITDA, which more accurately reflects the cash earning power of the Company as an operating and consolidation platform.
Consolidated EBITDA and Adjusted Consolidated EBITDA
Consolidated EBITDA and Adjusted Consolidated EBITDA are defined above. Our Adjusted Consolidated EBITDA include adjustments for Special Items that we believe do not directly reflect our core operations and may not be indicative of our normal business operations.
How These Measures Are Useful
When used in conjunction with GAAP financial measures, our Total Field EBITDA, Consolidated EBITDA and Adjusted Consolidated EBITDA are supplemental measures of operating performance that we believe are useful measures to facilitate comparisons to our historical consolidated and business level performance and operating results.
We believe our presentation of Adjusted Consolidated EBITDA, a key metric used internally by our management, provides investors with a supplemental view of our operating performance that facilitates analysis and comparisons of our ongoing business operations because it excludes items that may not be indicative of our ongoing operating performance.
Limitations of the Usefulness of These Measures
Our Total Field EBITDA, Consolidated EBITDA and Adjusted Consolidated EBITDA are not necessarily comparable to similarly titled measures used by other companies due to different methods of calculation. Our presentation is not intended to be considered in isolation or as a substitute for, or superior to, the financial information prepared and presented in accordance with GAAP. Funeral Field EBITDA, Cemetery Field EBITDA, Funeral Financial Field EBITDA, Cemetery Financial Field EBITDA, Ancillary EBITDA and Divested/Planned Divested EBITDA are not consolidated measures of profitability.
Funeral and Cemetery Field EBITDA excludes certain costs presented in our GAAP statement that we do not allocate to the individual business’ field level margins, as noted above. A reconciliation to Funeral and Cemetery Operating Income, the most directly comparable GAAP measure, is set forth below.
Consolidated EBITDA excludes certain items that we believe do not directly reflect our core operations and may not be indicative of our normal business operations. A reconciliation to Net Income, the most directly comparable GAAP measure, is set forth below.
Therefore, these measures may not provide a complete understanding of our performance and should be reviewed in conjunction with our GAAP financial measures.
RECONCILIATION OF NON-GAAP FINANCIAL MEASURES
This press release includes the use of certain financial measures that are not GAAP measures. The Non-GAAP financial measures are presented for additional information and are reconciled to their most comparable GAAP measures, all of which are reflected in the tables below.
Reconciliation of Net Income to Adjusted Net Income (in thousands):
| 3RDQTR 2021 | 4THQTR 2021 | 1STQTR 2022 | 2NDQTR 2022 | 3RDQTR 2022 | ||||||||||||||||
| Net Income | $ | 13,046 | $ | 13,347 | $ | 16,402 | $ | 10,899 | $ | 5,860 | ||||||||||
| Special Items | ||||||||||||||||||||
| Severance and Separation Costs | — | — | — | — | 1,431 | |||||||||||||||
| Net (Gain) Loss on Divestitures | 282 | (1,035 | ) | 703 | (1,278 | ) | — | |||||||||||||
| Impairment of | 500 | — | — | — | — | |||||||||||||||
| — | — | (1,899 | ) | (1,376 | ) | — | ||||||||||||||
| Litigation Reserve | — | 1,050 | — | 200 | — | |||||||||||||||
| Disaster Recovery and Pandemic Costs | 1,002 | 116 | 168 | — | — | |||||||||||||||
| Other Special Items | 1,020 | — | — | — | — | |||||||||||||||
| Change in Uncertain Tax Reserves and Other(1) | — | — | (533 | ) | — | — | ||||||||||||||
| Sum of Special Items | $ | 2,804 | $ | 131 | $ | (1,561 | ) | $ | (2,454 | ) | $ | 1,431 | ||||||||
| Tax Effect on Special Items(2) | 738 | (116 | ) | (273 | ) | (653 | ) | 356 | ||||||||||||
| Adjusted Net Income | $ | 15,112 | $ | 13,594 | $ | 15,114 | $ | 9,098 | $ | 6,935 | ||||||||||
| (1) | The Change in Uncertain Tax Reserves and Other are not tax effected. | |
| (2) | Special Items are taxed at the operating tax rate. |
Reconciliation of Net Income to Consolidated EBITDA, Adjusted Consolidated EBITDA (in thousands) and Adjusted Consolidated EBITDA Margin:
| 3RDQTR 2021 | 4THQTR 2021 | 1STQTR 2022 | 2NDQTR 2022 | 3RDQTR 2022 | ||||||||||||||||
| Net Income | $ | 13,046 | $ | 13,347 | $ | 16,402 | $ | 10,899 | $ | 5,860 | ||||||||||
| Total Expense for Income Taxes | 5,122 | 4,574 | 5,082 | 4,221 | 2,779 | |||||||||||||||
| Income Before Income Taxes | $ | 18,168 | $ | 17,921 | $ | 21,484 | $ | 15,120 | $ | 8,639 | ||||||||||
| Depreciation & Amortization | 4,950 | 5,034 | 4,783 | 5,112 | 4,716 | |||||||||||||||
| Non-Cash Stock Compensation | 1,294 | 1,681 | 1,607 | 1,478 | 1,493 | |||||||||||||||
| Interest Expense | 5,076 | 5,307 | 5,542 | 5,988 | 6,678 | |||||||||||||||
| Net (Gain) Loss on Divestitures | 282 | (1,035 | ) | 703 | (1,278 | ) | — | |||||||||||||
| Impairment of | 500 | — | — | — | — | |||||||||||||||
| — | — | (1,899 | ) | (1,376 | ) | — | ||||||||||||||
| Net (Gain) Loss on Disposal of Fixed Assets | 76 | 324 | 64 | 85 | (7 | ) | ||||||||||||||
| Other, Net | 21 | (3 | ) | 24 | (7 | ) | (95 | ) | ||||||||||||
| Consolidated EBITDA | $ | 30,367 | $ | 29,229 | $ | 32,308 | $ | 25,122 | $ | 21,424 | ||||||||||
| Adjusted For: | ||||||||||||||||||||
| Severance and Separation Costs | — | — | — | — | 1,431 | |||||||||||||||
| Litigation Reserve | — | 1,050 | — | 200 | — | |||||||||||||||
| Disaster Recovery and Pandemic Costs | 1,002 | 116 | 168 | — | — | |||||||||||||||
| Other Special Items | 1,020 | — | — | — | — | |||||||||||||||
| Adjusted Consolidated EBITDA | $ | 32,389 | $ | 30,395 | $ | 32,476 | $ | 25,322 | $ | 22,855 | ||||||||||
| Total Revenue | $ | 95,041 | $ | 95,931 | $ | 98,161 | $ | 90,600 | $ | 87,497 | ||||||||||
| Adjusted Consolidated EBITDA Margin | 34.1 | % | 31.7 | % | 33.1 | % | 27.9 | % | 26.1 | % | ||||||||||
| Net Income Margin | 13.7 | % | 13.9 | % | 16.7 | % | 12.0 | % | 6.7 | % | ||||||||||
Components of Total Revenue (in thousands):
| 3RDQTR 2021 | 4THQTR 2021 | 1STQTR 2022 | 2NDQTR 2022 | 3RDQTR 2022 | |||||||||||||||
| Same Store Funeral Revenue | $ | 57,321 | $ | 57,441 | $ | 61,761 | $ | 50,757 | $ | 51,258 | |||||||||
| Acquisition Funeral Revenue | 7,651 | 8,007 | 8,610 | 7,641 | 7,813 | ||||||||||||||
| Same Store Cemetery Revenue | 16,342 | 16,288 | 14,251 | 16,969 | 15,396 | ||||||||||||||
| Acquisition Cemetery Revenue | 6,362 | 6,312 | 6,297 | 8,193 | 5,947 | ||||||||||||||
| Funeral Financial Revenue | 2,265 | 2,512 | 2,468 | 2,285 | 2,474 | ||||||||||||||
| Cemetery Financial Revenue | 3,388 | 3,661 | 3,258 | 3,500 | 3,374 | ||||||||||||||
| Ancillary Revenue | 1,096 | 1,046 | 1,070 | 980 | 1,049 | ||||||||||||||
| Divested/Planned Divested Funeral Revenue | 564 | 578 | 446 | 275 | 186 | ||||||||||||||
| Divested Cemetery Revenue | 52 | 86 | — | — | — | ||||||||||||||
| Total Revenue | $ | 95,041 | $ | 95,931 | $ | 98,161 | $ | 90,600 | $ | 87,497 | |||||||||
Reconciliation of Funeral and Cemetery Operating Income to Funeral and Cemetery Field EBITDA (in thousands):
| 3RDQTR 2021 | 4THQTR 2021 | 1STQTR 2022 | 2NDQTR 2022 | 3RDQTR 2022 | ||||||||||||||||
| Funeral Operating Income (GAAP) | $ | 22,924 | $ | 23,187 | $ | 25,463 | $ | 18,485 | $ | 17,584 | ||||||||||
| Depreciation & Amortization | 2,761 | 2,766 | 2,871 | 2,827 | 2,858 | |||||||||||||||
| Regional & Unallocated Costs | 4,907 | 5,419 | 4,634 | 4,034 | 3,731 | |||||||||||||||
| Net (Gain) Loss on Divestitures, Disposals and Impairment Charges | 763 | (810 | ) | 767 | (1,194 | ) | — | |||||||||||||
| Less: | ||||||||||||||||||||
| Funeral Financial EBITDA | (1,974 | ) | (2,251 | ) | (2,177 | ) | (1,981 | ) | (2,216 | ) | ||||||||||
| Ancillary EBITDA | (274 | ) | (216 | ) | (221 | ) | (151 | ) | (188 | ) | ||||||||||
| Funeral Divested/Planned Divested EBITDA | (92 | ) | (127 | ) | (27 | ) | 75 | (16 | ) | |||||||||||
| Funeral Field EBITDA | $ | 29,015 | $ | 27,968 | $ | 31,310 | $ | 22,095 | $ | 21,753 | ||||||||||
| Funeral Revenue | $ | 68,897 | $ | 69,584 | $ | 74,355 | $ | 61,938 | $ | 62,780 | ||||||||||
| Funeral Operating Income Margin | 33.3 | % | 33.3 | % | 34.2 | % | 29.8 | % | 28.0 | % | ||||||||||
| 3RDQTR 2021 | 4THQTR 2021 | 1STQTR 2022 | 2NDQTR 2022 | 3RDQTR 2022 | ||||||||||||||||
| Cemetery Operating Income (GAAP) | $ | 9,471 | $ | 9,891 | $ | 8,218 | $ | 10,421 | $ | 8,023 | ||||||||||
| Depreciation & Amortization | 1,914 | 1,868 | 1,758 | 2,130 | 1,701 | |||||||||||||||
| Regional & Unallocated Costs | 1,905 | 1,772 | 1,713 | 1,932 | 1,365 | |||||||||||||||
| Net (Gain) Loss on Divestitures, Disposals and Impairment Charges | 6 | 96 | 30 | — | (9 | ) | ||||||||||||||
| Less: | ||||||||||||||||||||
| Cemetery Financial EBITDA | (3,265 | ) | (3,532 | ) | (3,120 | ) | (3,364 | ) | (3,233 | ) | ||||||||||
| Cemetery Divested EBITDA | (19 | ) | (16 | ) | — | — | — | |||||||||||||
| Cemetery Field EBITDA | $ | 10,012 | $ | 10,079 | $ | 8,599 | $ | 11,119 | $ | 7,847 | ||||||||||
| Cemetery Revenue | $ | 26,144 | $ | 26,347 | $ | 23,806 | $ | 28,662 | $ | 24,717 | ||||||||||
| Cemetery Operating Income Margin | 36.2 | % | 37.5 | % | 34.5 | % | 36.4 | % | 32.5 | % | ||||||||||
Components of Total Field EBITDA (in thousands):
| 3RDQTR 2021 | 4THQTR 2021 | 1STQTR 2022 | 2NDQTR 2022 | 3RDQTR 2022 | ||||||||||||||||
| Funeral Field EBITDA | $ | 29,015 | $ | 27,968 | $ | 31,310 | $ | 22,095 | $ | 21,753 | ||||||||||
| Cemetery Field EBITDA | 10,012 | 10,079 | 8,599 | 11,119 | 7,847 | |||||||||||||||
| Funeral Financial EBITDA | 1,974 | 2,251 | 2,177 | 1,981 | 2,216 | |||||||||||||||
| Cemetery Financial EBITDA | 3,265 | 3,532 | 3,120 | 3,364 | 3,233 | |||||||||||||||
| Ancillary EBITDA | 274 | 216 | 221 | 151 | 188 | |||||||||||||||
| Funeral Divested/Planned Divested EBITDA | 92 | 127 | 27 | (75 | ) | 16 | ||||||||||||||
| Cemetery Divested EBITDA | 19 | 16 | — | — | — | |||||||||||||||
| Total Field EBITDA | $ | 44,651 | $ | 44,189 | $ | 45,454 | $ | 38,635 | $ | 35,253 | ||||||||||
Reconciliation of GAAP Basic Earnings Per Share to Adjusted Basic Earnings Per Share:
| 3RDQTR 2021 | 4THQTR 2021 | 1STQTR 2022 | 2NDQTR 2022 | 3RDQTR 2022 | ||||||||||||||||
| GAAP Basic Earnings Per Share | $ | 0.74 | $ | 0.82 | $ | 1.07 | $ | 0.74 | $ | 0.40 | ||||||||||
| Special Items | 0.12 | 0.01 | (0.08 | ) | (0.13 | ) | 0.07 | |||||||||||||
| Adjusted Basic Earnings Per Share | $ | 0.86 | $ | 0.83 | $ | 0.99 | $ | 0.61 | $ | 0.47 | ||||||||||
Reconciliation of GAAP Diluted Earnings Per Share to Adjusted Diluted Earnings Per Share:
| 3RDQTR 2021 | 4THQTR 2021 | 1STQTR 2022 | 2NDQTR 2022 | 3RDQTR 2022 | ||||||||||||||||
| GAAP Diluted Earnings Per Share | $ | 0.71 | $ | 0.77 | $ | 1.00 | $ | 0.69 | $ | 0.38 | ||||||||||
| Special Items | 0.11 | 0.01 | (0.08 | ) | (0.11 | ) | 0.07 | |||||||||||||
| Adjusted Diluted Earnings Per Share | $ | 0.82 | $ | 0.78 | $ | 0.92 | $ | 0.58 | $ | 0.45 | ||||||||||
Reconciliation of Cash Provided by Operating Activities to Adjusted Free Cash Flow (in thousands) and Adjusted Free Cash Flow Margin:
| 3RDQTR 2021 | 4THQTR 2021 | 1STQTR 2022 | 2NDQTR 2022 | 3RDQTR 2022 | ||||||||||||||||
| Cash Provided by Operating Activities | $ | 28,258 | $ | 14,547 | $ | 15,801 | $ | 14,376 | $ | 19,869 | ||||||||||
| Cash used for Maintenance Capital Expenditures | (4,358 | ) | (4,355 | ) | (3,612 | ) | (2,370 | ) | (3,728 | ) | ||||||||||
| Free Cash Flow | $ | 23,900 | $ | 10,192 | $ | 12,189 | $ | 12,006 | $ | 16,141 | ||||||||||
| Plus: Incremental Special Items: | ||||||||||||||||||||
| Severance and Separation Costs | — | — | — | — | 384 | |||||||||||||||
| Disaster Recovery and Pandemic Costs | 1,002 | 116 | 168 | — | — | |||||||||||||||
| Other Special Items | 1,020 | — | — | — | — | |||||||||||||||
| Adjusted Free Cash Flow | $ | 25,922 | $ | 10,308 | $ | 12,357 | $ | 12,006 | $ | 16,525 | ||||||||||
| Total Revenue | $ | 95,041 | $ | 95,931 | $ | 98,161 | $ | 90,600 | $ | 87,497 | ||||||||||
| Adjusted Free Cash Flow Margin | 27.3 | % | 10.7 | % | 12.6 | % | 13.3 | % | 18.9 | % | ||||||||||
| Cash Provided by Operating Activities as a Percentage of Total Revenue | 29.7 | % | 15.2 | % | 16.1 | % | 15.9 | % | 22.7 | % | ||||||||||
CAUTIONARY STATEMENT ON FORWARD-LOOKING STATEMENTS
Certain statements made herein or elsewhere by, or on behalf of, the Company that are not historical facts are intended to be forward-looking statements within the meaning of Section 27A of the Securities Act of 1933, as amended, and Section 21E of the Securities Exchange Act of 1934, as amended. In addition to historical information, this Press Release contains certain statements and information that may constitute forward-looking statements within the safe harbor provisions of the Private Securities Litigation Reform Act of 1995. All statements, other than statements of historical information, should be deemed to be forward-looking statements. These statements include, but are not limited to, statements regarding any projections of earnings, revenue, cash flow, investment returns, capital allocation, debt levels, equity performance, death rates, market share growth, overhead, including talent recruitment, field and corporate incentive compensation, or other financial items; any statements of the plans, strategies and objectives of management for future operations or financing activities, including, but not limited, to capital allocation, the ability to obtain credit or financing, and organizational performance; any statements of the plans, timing and objectives of management for acquisition activities; any statements regarding future economic conditions or performance; any statements of belief; and any statements of assumptions underlying any of the foregoing and are based on our current expectations and beliefs concerning future developments and their potential effect on us. The words “may”, “will”, “estimate”, “intend”, “believe”, “expect”, “seek”, “project”, “forecast”, “foresee”, “should”, “would”, “could”, “plan”, “anticipate” and other similar words or expressions are intended to identify forward-looking statements, which are generally not historical in nature. While management believes that these forward-looking statements are reasonable as and when made, there can be no assurance that future developments affecting us will be those that we anticipate. All comments concerning our expectations for future revenue and operating results are based on our forecasts for our existing operations and do not include the potential impact of any future acquisitions, except where specifically noted. Our forward-looking statements involve significant risks and uncertainties (some of which are beyond our control) and assumptions that could cause actual results to differ materially from our historical experience and our present expectations or projections. Important factors that could cause actual results to differ materially from those in the forward-looking statements include, but are not limited to, those summarized below:
- our ability to find and retain skilled personnel;
- the effects of our talent recruitment efforts, incentive and compensation plans and programs, including such effects on our Standards Operating Model and the Company’s operational and financial performance;
- our ability to execute our growth strategy;
- the execution of our Standards Operating, 4E Leadership and Standard Acquisition Models;
- the effects of competition;
- changes in the number of deaths in our markets;
- changes in consumer preferences and our ability to adapt to or meet those changes;
- our ability to generate preneed sales, including implementing our cemetery portfolio sales strategy, product development and optimization plans;
- the investment performance of our funeral and cemetery trust funds;
- fluctuations in interest rates;
- the effects of inflation to our business and financial condition and performance, including increased overall costs to our goods and services, the impact on customer preferences as a result of changes in discretionary income, and our ability, if at all, to mitigate such effects;
- our ability to obtain debt or equity financing on satisfactory terms to fund additional acquisitions, expansion projects, working capital requirements and the repayment or refinancing of indebtedness;
- our ability to meet the timing, objectives and expectations related to our capital allocation framework, including our forecasted rates of return, planned uses of free cash flow and future capital allocation, including share repurchases, potential strategic acquisitions, internal growth projects, dividend increases, or debt repayment plans;
- our ability to meet the projected financial and equity performance metrics to our updated rolling four quarter outlook, if at all;
- the timely and full payment of death benefits related to preneed funeral contracts funded through life insurance contracts;
- the financial condition of third-party insurance companies that fund our preneed funeral contracts;
- increased or unanticipated costs, such as insurance or taxes;
- our level of indebtedness and the cash required to service our indebtedness;
- changes in federal income tax laws and regulations and the implementation and interpretation of these laws and regulations by the
Internal Revenue Service ; - effects of the application of other applicable laws and regulations, including changes in such regulations or the interpretation thereof;
- the potential impact of epidemics and pandemics, including the COVID-19 coronavirus, including new variants of COVID-19, such as the Delta and Omicron variants, on customer preferences and on our business;
- government, social, business and other actions that have been and will be taken in response to pandemics, including potential responses to new variants of COVID-19, such as the Delta and Omicron variants;
- effects and expense of litigation;
- consolidation of the funeral and cemetery industry;
- our ability to identify and consummate strategic acquisitions, if at all, and successfully integrate acquired businesses with our existing businesses, including expected performance and financial improvements related thereto;
- economic, financial and stock market fluctuations,
- interruptions or security lapses of our information technology, including any cybersecurity or ransomware incidents,
- our failure to maintain effective control over financial reporting; and
- other factors and uncertainties inherent in the funeral and cemetery industry.
For additional information regarding known material factors that could cause our actual results to differ from our projected results, please see “Risk Factors” in our Annual Report on Form 10-K for the year ended
Investors are cautioned not to place undue reliance on forward-looking statements, which speak only as of the date hereof. We undertake no obligation to publicly update or revise any forward-looking statements after the date they are made, whether as a result of new information, future events or otherwise.

![]()
Figure 1
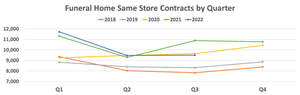
Funeral Home Same Store Contracts by Quarter
2022 GlobeNewswire, Inc., source

