“In our first year as a combined company we delivered exceptional operational performance at our upstream business, successfully integrated the assets acquired in the Husky transaction and aggressively reduced debt, creating a stronger company,” said
| Financial, production & throughput summary | |||||||||
| (For the period ended | 2021 Q4 | 2020 Q42 | % change2 | 2021 FY | 2020 FY2 | % change2 | |||
| Financial ($ millions, except per share amounts) | |||||||||
| Cash from operating activities | 2,184 | 250 | 774 | 5,919 | 273 | 2,068 | |||
| Adjusted funds flow3,4 | 1,948 | 333 | 485 | 7,248 | 117 | 6,095 | |||
| Per share (basic)3 | 0.97 | 0.27 | 3.59 | 0.10 | |||||
| Capital investment | 835 | 242 | 245 | 2,563 | 841 | 205 | |||
| Free funds flow3,4 | 1,113 | 91 | 1,123 | 4,685 | (724 | ) | |||
| Net earnings (loss) | (408 | ) | (153 | ) | 587 | (2,379 | ) | ||
| Per share (basic) | (0.21 | ) | (0.12 | ) | 0.27 | (1.94 | ) | ||
| Long-term debt | 12,385 | 7,441 | 66 | 12,385 | 7,441 | 66 | |||
| Net debt5 | 9,591 | 7,184 | 34 | 9,591 | 7,184 | 34 | |||
| Production and throughput (before royalties, net to Cenovus) | |||||||||
| Oil and NGLs (bbls/d)1 | 678,300 | 405,300 | 67 | 642,300 | 408,400 | 57 | |||
| Conventional natural gas (MMcf/d) | 883.5 | 369.5 | 139 | 895.5 | 379.0 | 136 | |||
| Total upstream production (BOE/d)1 | 825,300 | 467,200 | 77 | 791,500 | 471,700 | 68 | |||
| Total downstream throughput (bbls/d) | 469,900 | 169,000 | 178 | 508,000 | 185,900 | 173 | |||
1 See Advisory for production by product type.
2 Comparative figures include Cenovus results prior to the
3 Non-GAAP financial measure. See Advisory.
4 Prior period results have been restated to conform with the current definition of adjusted funds flow.
5 Specified financial measure. See Advisory.
Fourth quarter operating results1
In the fourth quarter, Cenovus achieved upstream production of 825,300 BOE/d, including record average daily oil sands production of almost 251,000 barrels per day (bbls/d) at
The Canadian Manufacturing segment also continued its strong and reliable performance. The crude utilization rate was 98%, with the Lloydminster Upgrader and
In the
“In 2021, we clearly delivered on our operational strength in the Upstream and Canadian Manufacturing businesses,” said Pourbaix. “In 2022, we are focused on building a similarly strong executional track record in
In the fourth quarter, Cenovus’s total revenues were slightly over
Downstream revenues rose to about
Upstream revenues rose to
6 Non-GAAP financial measure. Total operating margin is the total of Upstream operating margin plus Downstream operating margin. See Advisory.
Fourth quarter financial results
Cash from operating activities was
Cash flows were impacted in the fourth quarter by a realized risk management loss of
Cenovus recorded a net loss of
Full-year results1
On a full-year basis, Cenovus achieved total Upstream production of 791,500 BOE/d, reflecting production increases at most of the company’s assets, including record output in its Oil Sands segment over the course of the year. Total Oil Sands segment production was 581,500 bbls/d, including nearly 180,000 bbls/d at
In Canadian Manufacturing, average utilization for the year was 96% and average throughput was 106,500 bbls/d, reflecting the top-tier performance of the Lloydminster Upgrader and
Total revenues were about
Cash from operating activities was nearly
Portfolio update
During the fourth quarter, Cenovus reached agreements for asset sales with total proceeds of about
Cenovus agreed to sell its Husky retail fuels network for approximately
While Cenovus will always consider opportunities to optimize its asset portfolio, the company does not anticipate further significant divestitures in the near future.
Shareholder returns
The Board has declared a dividend of
| Preferred shares dividend summary | ||
| Rate (%) | Amount ($/share) | |
| Share series | ||
| Series 1 | 2.577 | 0.16106 |
| Series 2 | 1.859 | 0.11460 |
| Series 3 | 4.689 | 0.29306 |
| Series 5 | 4.591 | 0.28694 |
| Series 7 | 3.935 | 0.24594 |
All dividends paid on Cenovus’s common and preferred shares will be designated as "eligible dividends" for Canadian federal income tax purposes. Declaration of dividends is at the sole discretion of the Board and will continue to be evaluated on a quarterly basis.
Health and safety
To protect the health and safety of Cenovus staff and neighbouring communities, the company continues to follow its own robust COVID-19 protocols, as well as those outlined by regional health authorities across the company’s operating areas. This includes encouraging vaccination and employing rapid testing. Cenovus’s field operations continue to run safely and reliably. The company is monitoring the evolving public health situation and examining next steps around
Cenovus achieved strong occupational and process safety performance in the fourth quarter while completing maintenance work at assets across the company, which contributed to solid safety results for the full year. Cenovus remains focused on continuing to further build and sustain a culture that delivers continuous improvement in safety performance and a commitment to protect the environment. The company continued to harmonize major safety systems, programs and applications throughout 2021, with further work expected this year. Additionally, the company continues to roll out its Cenovus Operations Integrity Management System (COIMS). The COIMS framework defines what the company will do to manage health, safety, operations integrity and environmental risk.
Sustainability
During the fourth quarter, Cenovus set out ambitious targets for the company’s five environmental, social and governance (ESG) focus areas of climate & greenhouse gas (GHG) emissions, water stewardship, biodiversity, Indigenous reconciliation and inclusion & diversity. The targets, which are embedded in the company’s five-year business plan, include a reduction in absolute scope 1 and 2 GHG emissions of 35% by year-end 2035 from 2019 levels, on a net equity basis, and a longer-term ambition of net zero emissions by 2050. Other targets include a reduction in fresh water intensity by 20% in oil sands and in thermal operations by year-end 2030, reclaiming 3,000 decommissioned well sites by year-end 2025, restoring more habitat than the company uses in the
The Oil Sands Pathways to Net Zero initiative, co-founded by Cenovus, continued work on its foundational carbon capture, utilization and storage project. This first project is expected to include a pipeline with phased expansion capability to gather carbon dioxide from 20 oil sands facilities. Discussions are ongoing with the federal and provincial governments to ensure the necessary policy and financial support is in place for Pathways to achieve its ambitious vision, support the oil sands sector’s long-term contribution to
Reserves
Cenovus’s proved and probable reserves are evaluated each year by independent qualified reserves evaluators. At the end of 2021, Cenovus’s total proved reserves rose 21% to approximately 6.1 billion BOE, while total proved plus probable reserves increased 24% to approximately 8.3 billion BOE largely due to the Husky transaction. Total proved bitumen reserves were approximately 5.6 billion barrels, an increase of 16% from 2020, while total proved plus probable bitumen reserves rose 17% to approximately 7.4 billion barrels. At year-end 2021, Cenovus had a proved reserves life index of approximately 21 years, and a proved plus probable reserves life index of approximately 29 years.
More details about Cenovus’s reserves and other oil and gas information are available in the Advisory, and the Management’s Discussion & Analysis (MD&A), Annual Information Form (AIF) and Annual Report on Form 40-F for the year ended
Cenovus year-end disclosure documents
Today, Cenovus is filing its audited Consolidated Financial Statements, MD&A and AIF with Canadian securities regulatory authorities. The company is also filing its Annual Report on Form 40-F for the year ended
Conference call today Cenovus will host a conference call today, |
Advisory
Basis of Presentation
Cenovus reports financial results in Canadian dollars and presents production volumes on a net to Cenovus before royalties basis, unless otherwise stated. Cenovus prepares its financial statements in accordance with International Financial Reporting Standards (IFRS).
Oil and gas information
Reserves Life Index
Reserves life index is calculated based on reserves for the applicable reserves category divided by annual production.
Barrels of Oil Equivalent
Natural gas volumes have been converted to barrels of oil equivalent (BOE) on the basis of six thousand cubic feet (Mcf) to one barrel (bbl). BOE may be misleading, particularly if used in isolation. A conversion ratio of one bbl to six Mcf is based on an energy equivalency conversion method primarily applicable at the burner tip and does not represent value equivalency at the wellhead. Given that the value ratio based on the current price of crude oil compared with natural gas is significantly different from the energy equivalency conversion ratio of 6:1, utilizing a conversion on a 6:1 basis is not an accurate reflection of value.
Product types
| Product type by operating segment | ||
| Three months ended | Full year ended | |
| Oil Sands | ||
| Bitumen (Mbbls/d) | 606.0 | 561.3 |
| Heavy crude oil (Mbbls/d) | 18.9 | 20.2 |
| Conventional natural gas (MMcf/d) | 12.4 | 12.6 |
| Total Oil Sands segment production (BOE/d) | 626.9 | 583.5 |
| Conventional | ||
| Light crude oil (Mbbls/d) | 7.2 | 8.4 |
| Natural gas liquids (Mbbls/d) | 22.5 | 25.6 |
| Conventional natural gas (MMcf/d) | 574.3 | 597.6 |
| Total Conventional segment production (BOE/d) | 125.3 | 133.6 |
| Offshore | ||
| Light crude oil (Mbbls/d) | 10.6 | 14.1 |
| Natural gas liquids (Mbbls/d) | 13.1 | 12.7 |
| Conventional natural gas (MMcf/d) | 296.8 | 285.3 |
| Total Offshore segment production (BOE/d) | 73.1 | 74.4 |
| Total upstream production (BOE/d) | 825.3 | 791.5 |
Forward‐looking Information
This news release contains certain forward‐looking statements and forward‐looking information (collectively referred to as “forward‐looking information”) within the meaning of applicable securities legislation, including the
Forward‐looking information in this document is identified by words such as “achieve”, “anticipate”, “commitment”, “continue”, “deliver”, “expect”, “focus”, “next steps”, “positioned”, “target”, and “will” or similar expressions and includes suggestions of future outcomes, including, but not limited to, statements about: general and 2022 priorities; net debt and long-term debt; upstream production; downstream operations and performance; cash flow volatility; updating guidance; shareholder returns; the repurchase of Cenovus common shares; closing disposition transactions; asset portfolio optimization; divestitures; dividends; timing of office workforce returns; safety performance, programs and applications, including COIMS; protecting the environment; ESG target areas, including GHG emissions reductions for Cenovus and for the oil sands through the Oilsands Pathways to Net Zero initiative; fresh water intensity; reclaiming decommissioned well sites; habitat restoration; spending with Indigenous businesses; women in leadership roles; and reserves and reserves life index.
Developing forward‐looking information involves reliance on a number of assumptions and consideration of certain risks and uncertainties, some of which are specific to Cenovus and others that apply to the industry generally. The factors or assumptions on which the forward‐looking information in this news release are based include, but are not limited to: Cenovus’s ability to realize the anticipated benefits of the Husky transaction; the allocation of free finds flow to Cenovus’s balance sheet; commodity prices; future narrowing of crude oil differentials; Cenovus’s ability to produce on an unconstrained basis; Cenovus’s ability to access sufficient insurance coverage to pursue development plans; Cenovus’s ability to deliver safe and reliable operations and demonstrate strong governance; and the assumptions inherent in Cenovus’s updated 2022 Guidance available on cenovus.com.
The risk factors and uncertainties that could cause actual results to differ materially from the forward‐looking information in this news release include, but are not limited to: Cenovus’s ability to realize the anticipated benefits of the Husky transaction; the effectiveness of Cenovus’s risk management program; the accuracy of estimates regarding commodity prices, operating and capital costs and currency and interest rates; risks inherent in the operation of Cenovus’s business; ability to successfully complete development plans and improve asset performance; and risks associated with climate change and Cenovus’s assumptions relating thereto.
Except as required by applicable securities laws, Cenovus disclaims any intention or obligation to publicly update or revise any forward‐looking statements, whether as a result of new information, future events or otherwise.
Readers are cautioned that the foregoing lists are not exhaustive and are made as at the date hereof. Events or circumstances could cause actual results to differ materially from those estimated or projected and expressed in, or implied by, the forward‐looking information. For additional information regarding Cenovus’s material risk factors, the assumptions made, and risks and uncertainties which could cause actual results to differ from the anticipated results, refer to “Risk Management and Risk Factors” and “Advisory” in Cenovus’s MD&A for the period ended
Specified financial measures
This news release contains references to certain specified financial measures that do not have standardized meanings prescribed by IFRS. Readers should not consider these measures in isolation or as a substitute for analysis of the company’s results as reported under IFRS. These measures are defined differently by different companies and, therefore, might not be comparable to similar measures presented by other issuers. For information on the composition of these measures, as well as an explanation of how the company uses these measures, refer to the Specified Financial Measures Advisory located in Cenovus’s MD&A for the year ended
Upstream operating margin and Downstream operating margin
The following table illustrates the items comprising Upstream operating margin and Downstream operating margin.
| Upstream | Downstream | ||||||||||||||
| Three Months Ended | Oil Sands (i) | Conventional(i) | Offshore (i) | Total | Canadian Manufacturing (i) | Manufacturing (i) | Retail (i) | Total | |||||||
| Revenues | |||||||||||||||
| Gross Sales | 6,117 | 833 | 404 | 7,354 | 1,215 | 5,723 | 592 | 7,530 | |||||||
| Less: Royalties | 669 | 40 | 24 | 733 | — | — | — | — | |||||||
| 5,448 | 793 | 380 | 6,621 | 1,215 | 5,723 | 592 | 7,530 | ||||||||
| Expenses | |||||||||||||||
| Purchased Product | 825 | 445 | — | 1,270 | 986 | 5,171 | 551 | 6,708 | |||||||
| Transportation and Blending | 1,918 | 20 | 3 | 1,941 | — | — | — | — | |||||||
| Operating | 616 | 135 | 49 | 800 | 99 | 413 | 25 | 537 | |||||||
| Realized (Gain) Loss on Risk Management | 166 | 2 | — | 168 | — | 17 | — | 17 | |||||||
| Operating Margin | 1,923 | 191 | 328 | 2,442 | 130 | 122 | 16 | 268 | |||||||
(i) Found in Note 1 of the
Total operating margin
Total operating margin is the total of Upstream operating margin plus Downstream operating margin.
| Upstream (i) | Downstream (i) | Total | ||||||||||||||||||||||
| ($ millions) | 2021 | Q4 2021 | Q3 2021 | 2020 | 2021 | Q4 2021 | Q3 2021 | 2020 | 2021 | Q4 2021 | Q3 2021 | 2020 | ||||||||||||
| Revenues | ||||||||||||||||||||||||
| Gross Sales | 27,844 | 8,237 | 7,354 | 9,708 | 26,673 | 8,135 | 7,530 | 4,815 | 54,517 | 16,372 | 14,884 | 14,523 | ||||||||||||
| Less: Royalties | 2,454 | 815 | 733 | 371 | — | — | — | — | 2,454 | 815 | 733 | 371 | ||||||||||||
| 25,390 | 7,422 | 6,621 | 9,337 | 26,673 | 8,135 | 7,530 | 4,815 | 52,063 | 15,557 | 14,151 | 14,152 | |||||||||||||
| Expenses | ||||||||||||||||||||||||
| Purchased Product | 4,843 | 1,410 | 1,270 | 1,530 | 23,526 | 7,348 | 6,708 | 4,429 | 28,369 | 8,758 | 7,978 | 5,959 | ||||||||||||
| Transportation and Blending | 7,930 | 2,387 | 1,941 | 4,764 | — | — | — | — | 7,930 | 2,387 | 1,941 | 4,764 | ||||||||||||
| Operating | 3,241 | 865 | 800 | 1,476 | 2,258 | 689 | 537 | 785 | 5,499 | 1,554 | 1,337 | 2,261 | ||||||||||||
| Realized (Gain) Loss on Risk Management | 788 | 202 | 168 | 268 | 104 | 56 | 17 | (21 | ) | 892 | 258 | 185 | 247 | |||||||||||
| Operating Margin | 8,588 | 2,558 | 2,442 | 1,299 | 785 | 42 | 268 | (378 | ) | 9,373 | 2,600 | 2,710 | 921 | |||||||||||
(i) Found in Note 1 of the
Adjusted funds flow and free funds flow
The following table provides a reconciliation of cash from (used in) operating activities found in the company’s Consolidated Financial Statements to adjusted funds flow and free funds flow. Adjusted funds flow per share is calculated by dividing adjusted funds flow by the weighted average number of common shares outstanding during the period and may be useful to evaluate a company’s ability to generate cash.
| Twelve Months Ended | Three Months Ended | ||||||||||
| ($ millions) | 2021 | 2020 | 2021 | 2020 | |||||||
| Cash From (Used in) Operating Activities (i) | 5,919 | 273 | 2,184 | 250 | |||||||
| (Add) Deduct: | |||||||||||
| Settlement of Decommissioning Liabilities | (102 | ) | (42 | ) | (35 | ) | (6 | ) | |||
| Net Change in | (1,227 | ) | 198 | 271 | (77 | ) | |||||
| Adjusted Funds Flow | 7,248 | 117 | 1,948 | 333 | |||||||
| 2,563 | 841 | 835 | 242 | ||||||||
| Free Funds Flow | 4,685 | (724 | ) | 1,113 | 91 | ||||||
(i) Found in the
Net debt
The following table provides a reconciliation of short-term borrowings and the current and long-term portions of long-term debt found in Cenovus’s Consolidated Financial Statements to net debt.
| As at ($ millions) | 2021 (i) | 2021 (i) | 2021 (ii) | 2020 (i) | |||||||
| Short-Term Borrowings | 79 | 48 | 161 | 121 | |||||||
| Current Portion of Long-Term Debt | — | 545 | — | — | |||||||
| Long-Term Debt | 12,385 | 12,441 | 14,043 | 7,441 | |||||||
| Less: Cash and Cash Equivalents | (2,873 | ) | (2,010 | ) | (1,113 | ) | (378 | ) | |||
| Net Debt | 9,591 | 11,024 | 13,091 | 7,184 | |||||||
(i) Found in the
(ii) Includes
Find Cenovus on Facebook, Twitter, LinkedIn, YouTube and Instagram.
Cenovus contacts
| Investors | Media |
| Investor Relations general line 403-766-7711 | Media Relations general line 403-766-7751 |
Photos accompanying this announcement are available at
https://www.globenewswire.com/NewsRoom/AttachmentNg/6d68575d-0536-4283-adc9-14d859774234
https://www.globenewswire.com/NewsRoom/AttachmentNg/0bce3de6-e947-488b-abd1-a897e88b0c1b

![]()
Liwan rig
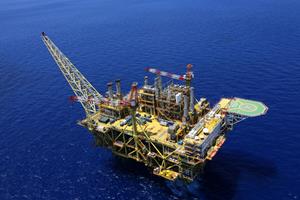
The platform at Husky’s Liwan Gas Project offshore China .
Cenovus's Christina Lake project
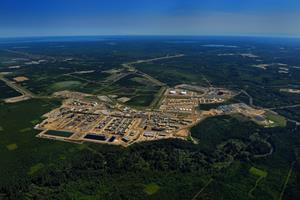
Cenovus's Christina Lake project in northern Alberta uses steam-assisted gravity drainage (SAGD) to produce oil.
2022 GlobeNewswire, Inc., source

