All figures are in United States dollars and all production figures are on a 100% basis unless otherwise stated. This news release contains forward looking information regarding Centerra Gold’s business and operations. See “Caution Regarding Forward-Looking Information”.
TORONTO, Nov. 04, 2020 (GLOBE NEWSWIRE) -- Centerra Gold Inc. (“Centerra” or the “Company”) (TSX: CG) today reported its third quarter 2020 results. Key events and operating results of the third quarter included:
- Net earnings of $205.7 million and $0.70 per common share (basic).
- Cash flow from operations of $358.8 million, and free cash flowNG of $281 million.
- Cash position of $484.2 million at quarter end with total liquidity of $984.2 million.
- Production totalled 241,448 ounces of gold and 23.3 million pounds of copper.
- Production costs per ounce of gold sold and production costs per pound of copper sold were $386 per ounce and $0.95 per pound, respectively.
- All-in sustaining costs on a by-product basis per ounce soldNG were $528 per ounce.
- Guidance Update: No change to gold production guidance targeted at 740,000 to 820,000 ounces. Guidance for full year all-in sustaining costs on a by-product basis per ounce soldNG has been reduced to $740 to $790 (previously $820 to $870 per ounce).
- The Kumtor Mine is on target to achieve both production and cost guidance for 2020.
- We continue to advance work on the Kumtor technical report.
- Quarterly Dividend of CAD$0.05 per common share.
All references in this document denoted with NG, indicate a non-GAAP term which is discussed under “Non-GAAP Measures” and reconciled to the most directly comparable GAAP measure.
Commentary
Scott Perry, President and Chief Executive Officer of Centerra stated, “We continue to stay vigilant at all of our operations to prevent an outbreak and avoid the spread of the COVID-19 virus and to ensure the health, safety and well-being of our employees, contractors and communities. We are also carefully observing the unfolding political events in the Kyrgyz Republic in order to ensure uninterrupted operations at Kumtor.”
“At our Öksüt operation, we have celebrated a recent safety milestone, when on July 19, 2020, Öksüt achieved 3 million consecutive hours without a lost time injury. Our continued commitment to Work Safe Home Safe is a driving force behind achieving such milestones.”
“The strong operating performance at Kumtor and Mount Milligan continued into this quarter and our Öksüt Mine demonstrated the additional value it brings to our operating portfolio on all metrics; production, low cost and free cash flow generation. We have re-affirmed our Company-wide full year gold production guidance of 740,000 to 820,000 ounces with year to date production of 651,614 ounces and expect to be near the upper end of guidance for the year. We have reduced our all-in sustaining costs on a by-product basis per ounce soldNG guidance to $740 to $790 per ounce from previously issued guidance of $820 to $870 per ounce, due to performance to date at both the Mount Milligan and Öksüt mines. The Mount Milligan Mine in the first nine months of 2020 also achieved an important milestone, producing the highest level of concentrate tonnes (138,972 tonnes) since the start of the operations in 2014. We continue to advance the Kumtor technical report, with additional work being incorporated into the new life of mine plan with respect to mining costs, recoveries and waste rock stability assessments.”
“Our operations in the quarter delivered consolidated gold production of 241,448 ounces at all-in sustaining costsNG on a by-product basis of $528 per ounce sold in the quarter. Kumtor had another strong quarter producing 140,182 ounces of gold at all-in sustaining costsNG on a by-product basis of $639 per ounce sold. Mount Milligan produced 49,854 ounces of gold and 23.3 million pounds of copper at all-in sustaining costsNG on a by-product basis of $165 per ounce sold. Öksüt continued to ramp up production, producing 51,412 ounces of gold, during the quarter, at an all-in sustaining costsNG on a by-product basis of $416 per ounce. Öksüt year to date, is our lowest cost mine with an all-in sustaining costsNG on a by-product basis of $433 per ounce.”
“Financially, the Company generated $358.8 million of cash from operations for the third quarter of 2020, which includes $208.3 million from Kumtor, $70.4 million from Mount Milligan and $85.4 million from Öksüt. During the third quarter of 2020, Kumtor, Mount Milligan and Öksüt delivered free cash flow from mine operationsNG of $157.3 million, $63.1 million and $74.1 million, respectively. Company-wide, free cash flowNG in the third quarter of 2020 was $281 million resulting in year-to-date free cash flowNG of $526.9 million and we finished the quarter with cash of $484.2 million and no debt.”
Guidance
Consolidated gold production in the first nine months of 2020 was 651,614 ounces compared to the full year guidance range of 740,000 to 820,000 ounces, which remains unchanged.
Centerra has reduced its consolidated 2020 guidance for production costs per ounce of gold sold to $410 to $460 per ounce and its guidance for all-in sustaining costs on a by-product basis per ounce soldNG to $740 to $790 per ounce from previously issued guidance of $450 to $500 per ounce and $820 to $870 per ounce, respectively, as a result of lower operating costs at the Mount Milligan and higher production at the Öksüt Mine.
Mount Milligan’s 2020 guidance for production costs per ounce of gold sold has been lowered to $730 to $780 per ounce and its guidance for all-in sustaining costs on a by-product basis per ounce soldNG has been lowered to $750 to $800 per ounce from previously issued guidance of $750 to $800 per ounce and $885 to $935 per ounce, respectively, due to decreased milling and mining costs.
Öksüt’s 2020 guidance for production costs per ounce of gold sold has been lowered to $345 to $395 per ounce and its guidance for all-in sustaining costs on a by-product basis per ounce soldNG has been reduced to $500 to $550 per ounce from previously issued guidance of $375 to $550 per ounce and $650 to $700 per ounce, respectively. This reduction is due to a combination of positive grade and tonne reconciliations, and effective cost control during this initial year of production.
COVID-19 Update
Centerra continues to prioritize the health, safety and well-being of its employees, contractors, communities, and other stakeholders during the current outbreak of COVID-19 and to take steps to minimize the effect of the pandemic on its business. The Company has established strict COVID-19 protocols at its mine sites to help prevent infection and reduce the potential transmission of COVID-19, implemented travel restrictions, and has temporarily closed various administration offices including its head office in Toronto. In addition, operating mine sites continue to assess the resiliency of their supply chains, increase mine site inventories of key materials and develop and implement contingency plans to allow for continued operations.
COVID-19 has not materially negatively affected Centerra’s operations. Employee absences due to COVID-19 and other illnesses have so far been successfully managed. Though such absences at Kumtor resulted in a reduction in mining capacity in the second and third quarters of 2020, they are not expected to materially affect Kumtor’s 2020 production and costs. For more details, please refer to “Operating Mines and Facilities - Kumtor Mine” in the Company’s management’s discussions and analysis dated November 3, 2020.
The Company notes that the effects of COVID-19 on its business continue to change rapidly. The measures enacted to date reflect the Company’s best assessment at this time but will remain flexible and be revised as necessary or advisable and/or as recommended by the public health and governmental authorities.
Kyrgyz Republic
Despite political and social disruption in the Kyrgyz Republic following its recent Parliamentary election held during the first week of October 2020, operations at the Kumtor Mine continue. Mining and gold production continue at targeted rates, and regular gold shipments are being made. No disruptions have occurred to the mine’s supply chain as borders are open for cargo and customs is functioning normally.
The Company understands that other mining companies within the Kyrgyz Republic experienced property damage and interruption in their operations in connection with protests that occurred following the October 4, 2020 parliamentary elections. While Kumtor did not experience any material issues at its offices or mine site, the Company and Kumtor will continue to remain on alert. The Company is monitoring the situation and is taking all the necessary precautions to ensure the safety of its personnel and operations. Centerra and Kumtor will continue to cooperate and work with the Kyrgyz Government and state agencies to ensure uninterrupted operation of the mine.
An interim government led by Prime Minister Sadyr Japarov has been installed in the Kyrgyz Republic and, following the resignation of former President Sooronbai Jeenbekov, Mr. Japarov is also acting President. The Company further understands that new presidential elections have been scheduled for January 10, 2021 but that new parliamentary elections are yet to be scheduled.
Exploration Update
Exploration activities in the third quarter of 2020 included drilling, surface sampling, geological mapping and geophysical surveying at the Company’s various projects (including earn-in properties), targeting gold and copper mineralization in Canada, Turkey, Finland, USA and the Kyrgyz Republic. In the third quarter of 2020, the Company ceased exploration activities in Mexico. The Company has expanded its 2020 exploration program when compared to 2019 and is primarily focused on brownfield exploration at Kumtor, Mount Milligan and Öksüt. Exploration expenditures totalled $11.7 million in the third quarter of 2020, which reflect the impact of delays associated with COVID-19, compared to $7.6 million in the same quarter of 2019.
Selected drill program results and intercepts are highlighted in the supplementary data at the end of this news release. The drill collar locations and associated graphics are available at the following link:
About Centerra
Centerra Gold Inc. is a Canadian-based gold mining company focused on operating, developing, exploring and acquiring gold properties in North America, Asia and other markets worldwide and is one of the largest Western-based gold producers in Central Asia. Centerra operates three mines, the Kumtor Mine in the Kyrgyz Republic, the Mount Milligan Mine in British Columbia, Canada and the Öksüt Mine in Turkey. Centerra's shares trade on the Toronto Stock Exchange (TSX) under the symbol CG. The Company is based in Toronto, Ontario, Canada.
Conference Call
Centerra invites you to join its 2020 third quarter conference call on Wednesday, November 4, 2020 at 9:00 AM Eastern Time. The call is open to all investors and the media. To join the call, please dial toll-free in North America 1 (800) 935-9319. International participants may access the call at +1 (416) 981-9009. Results summary slides are available on Centerra Gold’s website at www.centerragold.com. Alternatively, an audio feed webcast will be broadcast live by Intrado and can be accessed live at Centerra Gold’s website at www.centerragold.com. A recording of the call will be available on www.centerragold.com shortly after the call and via telephone until midnight Eastern Time on November 11, 2020 by calling (416) 626-4100 or (800) 558-5253 and using passcode 21970019.
For more information:
John W. Pearson
Vice President, Investor Relations
Centerra Gold Inc.
(416) 204-1953
john.pearson@centerragold.com
Additional information on Centerra is available on the Company’s web site at
www.centerragold.com and at SEDAR at www.sedar.com.
Management’s Discussion and Analysis
For the Period Ended September 30, 2020
This Management Discussion and Analysis (“MD&A”) has been prepared as of November 3, 2020, and is intended to provide a review of the financial position and results of operations of Centerra Gold Inc. (“Centerra” or the “Company”) for the three and nine months ended September 30, 2020 in comparison with the corresponding periods ended September 30, 2019. This discussion should be read in conjunction with the Company’s unaudited condensed consolidated interim financial statements and the notes thereto for the three and nine months ended September 30, 2020 prepared in accordance with International Financial Reporting Standards (“IFRS”). This MD&A should also be read in conjunction with the Company’s audited annual consolidated financial statements for the years ended December 31, 2019 and 2018, the related MD&A and the Annual Information Form for the year ended December 31, 2019 (the “2019 Annual Information Form”). The Company’s unaudited condensed consolidated interim financial statements and the notes thereto for the three and nine months ended September 30, 2020, 2019 Annual Report and 2019 Annual Information Form are available at www.centerragold.com and on the System for Electronic Document Analysis and Retrieval (“SEDAR”) at www.sedar.com. In addition, this discussion contains forward looking information regarding Centerra’s business and operations. Such forward-looking statements involve risks, uncertainties and other factors that could cause actual results to differ materially from those expressed or implied by such forward looking statements. See “Caution Regarding Forward-Looking Information” in this discussion. All dollar amounts are expressed in United States dollars (“USD”), except as otherwise indicated.
Caution Regarding Forward-Looking Information
Information contained in this document which are not statements of historical facts, and the documents incorporated by reference herein, may be “forward-looking information” for the purposes of Canadian securities laws. Such forward-looking information involves risks, uncertainties and other factors that could cause actual results, performance, prospects and opportunities to differ materially from those expressed or implied by such forward looking information. The words “believe”, “expect”, “anticipate”, “contemplate”, “plan”, “intends”, “continue”, “budget”, “estimate”, “may”, “will”, “schedule”, “understand” and similar expressions identify forward-looking information. These forward-looking statements relate to, among other things: statements regarding 2020 Outlook, including guidance on production, cost and capital spend for the remainder of 2020, and the assumptions used in preparing; the impact, if any, of the Kyrgyz Parliamentary election annulment and the aftermath on the Kumtor mine; planned exploration for the remainder of 2020; possible impacts to its operations relating to COVID-19; the Company’s expectations regarding having sufficient liquidity for 2020; the planned mill shut down at the Kumtor mine scheduled for the fourth quarter of 2020; the Company’s expectation regarding having sufficient water at Mount Milligan in the medium term, and its plans for a long term solution; time frame for completing the remaining construction at the Öksüt Mine; and expectations regarding litigation involving the Company including the HRS litigation impacting the Mount Milligan Mine, and the litigation involving the Greenstone Gold Property.
Forward-looking information is necessarily based upon a number of estimates and assumptions that, while considered reasonable by Centerra, are inherently subject to significant technical, political, business, economic and competitive uncertainties and contingencies. Known and unknown factors could cause actual results to differ materially from those projected in the forward-looking information. Factors and assumptions that could cause actual results or events to differ materially from current expectations include, among other things: (A) strategic, legal, planning and other risks, including: political risks associated with the Company’s operations in the Kyrgyz Republic, Turkey and Canada; the failure of the Kyrgyz Republic Government to comply with its continuing obligations under the Strategic Agreement, including the requirement that it comply at all times with its obligations under the Kumtor Project Agreements, allow for the continued operation of the Kumtor Mine by KGC and KOC and not take any expropriation action against the Kumtor Mine; actions by the Kyrgyz Republic Government or any state agency or the General Prosecutor's Office that serve to restrict or otherwise interfere with the payment of funds by KGC and KOC to Centerra; resource nationalism including the management of external stakeholder expectations; the impact of changes in, or to the more aggressive enforcement of, laws, regulations and government practices, including unjustified civil or criminal action against the Company, its affiliates or its current or former employees; risks that community activism may result in increased contributory demands or business interruptions; the risks related to outstanding litigation affecting the Company; the impact of the delay by relevant government agencies to provide required approvals, expertise and permits; potential impact on the Kumtor Project of investigations by Kyrgyz Republic instrumentalities; the impact of constitutional changes in Turkey; the impact of any sanctions imposed by Canada, the United States or other jurisdictions against various Russian and Turkish individuals and entities; potential defects of title in the Company’s properties that are not known as of the date hereof; the inability of the Company and its subsidiaries to enforce their legal rights in certain circumstances; the presence of a significant shareholder that is a state-owned company of the Kyrgyz Republic; risks related to anti-corruption legislation; risks related to the concentration of assets in Central Asia; Centerra not being able to replace mineral reserves; Indigenous claims and consultative issues relating to the Company’s properties which are in proximity to Indigenous communities; and potential risks related to kidnapping or acts of terrorism; (B) risks relating to financial matters, including: sensitivity of the Company’s business to the volatility of gold, copper and other mineral prices, the use of provisionally-priced sales contracts for production at Mount Milligan, reliance on a few key customers for the gold-copper concentrate at Mount Milligan, use of commodity derivatives, the imprecision of the Company’s mineral reserves and resources estimates and the assumptions they rely on, the accuracy of the Company’s production and cost estimates, the impact of restrictive covenants in the Company’s credit facilities which may, among other things, restrict the Company from pursuing certain business activities or making distributions from its subsidiaries, the Company’s ability to obtain future financing, the impact of global financial conditions, the impact of currency fluctuations, the effect of market conditions on the Company’s short-term investments, the Company’s ability to make payments including any payments of principal and interest on the Company’s debt facilities depends on the cash flow of its subsidiaries; and (C) risks related to operational matters and geotechnical issues and the Company’s continued ability to successfully manage such matters, including the movement of the Davidov Glacier, waste and ice movement and continued performance of the buttress at the Kumtor mine; the occurrence of further ground movements at the Kumtor mine and mechanical availability; the risk of having sufficient water to continue operations at the Mount Milligan mine and achieve expected mill throughput; the success of the Company’s future exploration and development activities, including the financial and political risks inherent in carrying out exploration activities; inherent risks associated with the use of sodium cyanide in the mining operations; the adequacy of the Company’s insurance to mitigate operational risks; mechanical breakdowns; the Company’s ability to replace its mineral reserves; the occurrence of any labour unrest or disturbance and the ability of the Company to successfully re-negotiate collective agreements when required; the risk that Centerra’s workforce and operations may be exposed to widespread epidemic including, but not limited to, the COVID-19 pandemic; seismic activity in the vicinity of the Company’s properties; long lead times required for equipment and supplies given the remote location of some of the Company’s operating properties; reliance on a limited number of suppliers for certain consumables, equipment and components; the ability of the Company to address physical and transition risks from climate change and sufficiently manage stakeholder expectations on climate-related issues; the Company’s ability to accurately predict decommissioning and reclamation costs; the Company’s ability to attract and retain qualified personnel; competition for mineral acquisition opportunities; risks associated with the conduct of joint ventures/partnerships; and the Company’s ability to manage its projects effectively and to mitigate the potential lack of availability of contractors, budget and timing overruns and project resources. For additional risk factors, please see section titled “Risks Factors” in the Company’s most recently filed Annual Information Form available on SEDAR at www.sedar.com.
There can be no assurances that forward-looking information and statements will prove to be accurate, as many factors and future events, both known and unknown could cause actual results, performance or achievements to vary or differ materially from the results, performance or achievements that are or may be expressed or implied by such forward-looking statements contained herein or incorporated by reference. Accordingly, all such factors should be considered carefully when making decisions with respect to Centerra, and prospective investors should not place undue reliance on forward looking information. Forward-looking information is as of November 3, 2020. Centerra assumes no obligation to update or revise forward-looking information to reflect changes in assumptions, changes in circumstances or any other events affecting such forward-looking information, except as required by applicable law.
TABLE OF CONTENTS
| Overview | 10 |
| Consolidated Financial and Operational Highlights | 11 |
| Overview of Consolidated Results | 12 |
| 2020 Outlook | 13 |
| Financial Performance | 17 |
| Balance Sheet Review | 19 |
| Market Conditions | 21 |
| Financial Instruments | 22 |
| Operating Mines and Facilities | 23 |
| Pre-Development Projects | 39 |
| Quarterly Results – Previous Eight Quarters | 40 |
| Contingencies | 41 |
| Accounting Estimates, Policies and Changes | 42 |
| Disclosure Controls and Procedures and Internal Control Over Financial Reporting | 42 |
| Non-GAAP Measures | 43 |
| Qualified Person & QA/QC – Production, Mineral Reserves and Mineral Resources | 48 |
Overview
Centerra is a Canadian-based gold mining company focused on operating, developing, exploring and acquiring gold properties worldwide and is one of the largest Western-based gold producers in Central Asia. Centerra’s principal operations are the Kumtor Gold Mine located in the Kyrgyz Republic, the Mount Milligan Gold-Copper Mine located in British Columbia, Canada, and the Öksüt Gold Mine located in Turkey. The Company has two properties in Canada in the pre-development stage, the Kemess Underground Gold Property and the Greenstone Gold Project (50% ownership), and owns exploration properties in Canada, the United States of America and Turkey and has options to acquire exploration joint venture properties in Canada, Finland, Turkey, and the United States of America. The Company owns various assets included in its Molybdenum Business Unit consisting of the Langeloth metallurgical processing facility and two primary molybdenum mines currently on care and maintenance, Thompson Creek Mine in Idaho, United States of America, and the Endako Mine in British Columbia, Canada (75% ownership).
As of September 30, 2020, Centerra’s significant subsidiaries are as follows:
| Current | Property | ||
| Entity | Property - Location | Status | Ownership |
| Kumtor Gold Company (“KGC”) | Kumtor Mine - Kyrgyz Republic | Operation | 100% |
| Thompson Creek Metals Company Inc. | Mount Milligan Mine - Canada | Operation | 100% |
| Öksüt Madencilik A.S. (“OMAS”) | Öksüt Mine - Turkey | Operation | 100% |
| Langeloth Metallurgical Company LLC | Langeloth - United States | Operation | 100% |
| AuRico Metals Inc. | Kemess Underground Project - Canada | Pre-development | 100% |
| Greenstone Gold Mines LP | Greenstone Gold Property - Canada | Pre-development | 50% |
| Thompson Creek Mining Co. | Thompson Creek Mine - United States | Care and Maintenance | 100% |
| Thompson Creek Metals Company Inc. | Endako Mine - Canada | Care and Maintenance | 75% |
Centerra’s common shares are listed for trading on the Toronto Stock Exchange under the symbol CG. As of November 3, 2020, there are 295,781,314 common shares issued and outstanding, options to acquire 3,380,657 common shares outstanding under its stock option plan and 937,689 units outstanding under its restricted share unit plan (exercisable on a 1:1 basis for common shares).
The Company reports the results of its operations in U.S. dollars, however not all of its costs are incurred in U.S. dollars. As such, the movement in exchange rates between currencies in which the Company incurs costs and the U.S. dollar also impacts reported costs of the Company.
Consolidated Financial and Operational Highlights
| Unaudited ($ millions, except as noted) | Three months ended September 30 | Nine months ended September 30 | ||||||||
| Financial Highlights | 2020 | 2019 | % Change | 2020 | 2019 | % Change | ||||
| Revenue | $ | 515.2 | $ | 388.3 | 33% | $ | 1,301.9 | $ | 1,062.8 | 22% |
| Production costs | 145.8 | 172.8 | (16%) | 452.4 | 527.2 | (14%) | ||||
| Depreciation, depletion and amortization | 83.2 | 66.8 | 24% | 241.6 | 180.2 | 34% | ||||
| Earnings from mine operations | 286.2 | 148.7 | 92% | 601.1 | 355.4 | 69% | ||||
| Net earnings (loss) | $ | 205.7 | $ | (165.1) | 225% | $ | 313.3 | $ | (81.3) | 485% |
| Adjusted net earnings (3) | $ | 205.7 | $ | 75.4 | 173% | $ | 356.8 | $ | 159.2 | 124% |
| Cash provided by operations | 358.8 | 31.9 | 1025% | 748.0 | 241.6 | 210% | ||||
| Adjusted cash provided by operations (3) | 363.8 | 94.5 | 285% | 753.0 | 304.2 | 148% | ||||
| Cash provided by operations before changes in working capital | 305.0 | 89.8 | 240% | 664.9 | 305.4 | 118% | ||||
| Free cash flow (deficit) (3) | 281.0 | (52.5) | 100% | 526.9 | 35.1 | 1401% | ||||
| Adjusted free cash flow (3) | 286.0 | 10.1 | 2732% | 531.9 | 97.7 | 444% | ||||
| Capital expenditures - sustaining | 19.8 | 21.2 | (7%) | 67.4 | 61.8 | 9% | ||||
| Capital expenditures - growth and development projects | 18.6 | 46.4 | (60%) | 49.5 | 109.2 | (55%) | ||||
| Capital expenditures - stripping | 41.6 | 23.6 | 76% | 128.3 | 62.0 | 107% | ||||
| Total assets | $ | 2,991.8 | $ | 2,697.8 | 11% | $ | 2,991.8 | $ | 2,697.8 | 11% |
| Long-term debt and lease obligations | 14.7 | 91.5 | (84%) | 14.7 | 91.5 | (84%) | ||||
| Cash, cash equivalents and restricted cash(5) | 485.8 | 109.1 | 345% | 485.8 | 109.1 | 345% | ||||
| Per Share Data | ||||||||||
| Earnings per common share - $ basic (1) | $ | 0.70 | $ | (0.56) | 225% | $ | 1.06 | $ | (0.28) | 479% |
| Adjusted net earnings per common share - $ basic (1)(3) | $ | 0.70 | $ | 0.26 | 169% | $ | 1.21 | $ | 0.54 | 124% |
| Per Ounce Data (except as noted) | ||||||||||
| Average gold spot price ($/oz)(2) | 1,911 | 1,474 | 30% | 1,737 | 1,363 | 27% | ||||
| Average realized gold price ($/oz)(3)(4) | 1,806 | 1,374 | 31% | 1,647 | 1,282 | 28% | ||||
| Average copper spot price ($/lb)(2) | 2.93 | 2.62 | 12% | 2.64 | 2.73 | (3%) | ||||
| Average realized copper price ($/lb)(3)(4) | 2.43 | 1.89 | 29% | 2.04 | 2.05 | (0%) | ||||
| Operating Highlights | ||||||||||
| Gold produced (oz's) | 241,448 | 205,660 | 17% | 651,614 | 588,802 | 11% | ||||
| Gold sold (oz's) | 238,069 | 216,023 | 10% | 658,866 | 610,761 | 8% | ||||
| Payable Copper Produced (000's lbs) | 23,305 | 21,229 | 10% | 62,441 | 53,066 | 18% | ||||
| Copper Sales (000's payable lbs) | 21,726 | 21,907 | (1%) | 61,502 | 53,129 | 16% | ||||
| Unit Costs | ||||||||||
| Production costs per ounce of gold sold (4) | $ | 386 | $ | 467 | (17%) | $ | 406 | $ | 469 | (13%) |
| Gold - All-in sustaining costs on a by-product basis ($/oz sold)(3)(4) | $ | 528 | $ | 666 | (21%) | $ | 665 | $ | 683 | (3%) |
| Gold - All-in sustaining costs on a by-product basis (including taxes) ($/oz sold)(3) (4) | $ | 701 | $ | 825 | (15%) | $ | 847 | $ | 832 | 2% |
| Gold - All-in sustaining costs on a co-product basis (before taxes) – ($/oz sold)(3)(4) | $ | 642 | $ | 717 | (10%) | $ | 728 | $ | 711 | 2% |
| Production costs per pound of copper sold (4) | $ | 0.95 | $ | 1.16 | (18%) | $ | 1.15 | $ | 1.43 | (20%) |
| Copper - All-in sustaining costs on a co-product basis – ($/lb)(3)(4) | $ | 1.18 | $ | 1.36 | (13%) | $ | 1.37 | $ | 1.72 | (20%) |
(1) As at September 30 2020, the Company had 295,740,940 common shares issued and outstanding.
(2) Average for the period as reported by the London Bullion Market Association (US dollar Gold P.M. Fix Rate) and London Metal Exchange (LME).
(3) Non-GAAP measure. See discussion under “Non-GAAP Measures”.
(4) Combines streamed and unstreamed amounts.
(5) Includes restricted cash of $1.6 million as at September 30, 2020 and restricted cash of $28.7 million as at September 30, 2019.
Overview of Consolidated Results
Third Quarter 2020 compared to Third Quarter 2019
Net earnings and adjusted net earningsNG of $205.7 million were recognized in the third quarter of 2020, compared to a net loss of $165.1 million and adjusted net earningsNG of $75.4 in the third quarter of 2019. The increase in adjusted net earningsNG was due to the new Öksüt Mine in 2020 with 51,120 gold ounces sold, higher average realized gold and copper prices, of 31% and 29%, respectively, and lower production costs at both Mount Milligan and Kumtor, partially offset by decreased gold ounces sold at Mount Milligan and Kumtor. In the third quarter of 2019, earnings were adjusted for a $230 million impairment of Mount Milligan.
Cash provided by operations of $358.8 million and adjusted cash provided by operationsNG of $363.8 million were recognized in the third quarter of 2020, compared to cash provided by operations of $31.9 million and adjusted cash provided by operationsNG of $94.5 million in the third quarter of 2019. The increase in adjusted cash provided by operationsNG was due to increased earnings from mine operations including earnings from the Öksüt Mine which began production in 2020, production from stockpiles at Kumtor, the timely collection of sales and the collection of $11.4 million United States tax refund at the Molybdenum business. In the third quarter of 2020 and 2019, the Company made payments of $5 million and $62.6 million, respectively, in accordance with the Strategic Agreement with Kyrgyz Republic.
Free cash flowNG of $281 million and adjusted free cash flowNG of $286 million were recognized in the third quarter of 2020 compared to a free cash flow deficitNG of $52.5 million and adjusted free cash flowNG of $10.1 million in the third quarter of 2019. The increase in adjusted free cash flowNG was due to higher cash provided by operations and a reduction in growth capital expenditures as construction of the Öksüt Mine was completed, partially offset by increased capitalized stripping at Kumtor.
First Nine Months 2020 compared to First Nine Months 2019
Net earnings of $313.3 million and adjusted net earningsNG of $356.8 million were recognized in the first nine months of 2020, compared to a net loss of $81.3 million and adjusted net earningsNG of $159.2 million in the first nine months of 2019. The increase in adjusted net earningsNG was due to 66,123 gold ounces sold at our new Öksüt Mine, 28% higher realized gold prices, increased copper pounds sold at Mount Milligan and lower production costs at both Mount Milligan and Kumtor. This was partially offset by decreased gold ounces sold at Mount Milligan due to mine plan sequencing.
Cash provided by operations of $748 million and adjusted cash provided by operationsNG of $753 million were recognized in the first nine months of 2020, compared to cash provided by operations of $241.6 million and adjusted cash provided by operationsNG of $304.2 million in the first nine months of 2019. The increase in adjusted cash provided by operationsNG was due to increased earnings from mine operations including contributions from the Öksüt Mine, production from stockpiles at Kumtor and a $22.8 million tax refund collected at the Molybdenum business.
Free cash flowNG of $526.9 million and adjusted free cash flowNG of $531.9 million was recognized in the first nine months of 2020 compared to free cash flowNG of $35.1 million and adjusted free cash flowNG of $97.7 million in the first nine months of 2019. The increase in adjusted free cash flowNG was due to higher cash provided by operations, a reduction in working capital and lower growth capital expenditures as construction at the Öksüt Mine was completed, partially offset by an increase in capitalized stripping at Kumtor.
Safety and Environment
During the quarter Centerra achieved a number of important Lost Time Injury (“LTI”) free milestones including 7 years without a LTI at Endako. In July 2020, Öksüt achieved three million LTI free work hours.
There were 12 reportable injuries in the third quarter of 2020, including 3 LTI, 7 medical aid injuries and 2 restricted work injuries. In the first nine months of 2020, Centerra incurred 28 reportable injuries, including 10 LTI, 12 medical aid injuries and 6 restricted work injuries.
Centerra has implemented a number of proactive measures to prevent infection and reduce the spread of COVID-19 for the safety of its employees, contractors, communities and other stakeholders.
There was one reportable environment incident in the third quarter and first nine months of 2020, involving migratory bird mortalities at the Kemess property, as a result of the birds becoming disorientated by the lighting on a drill rig.
2020 Outlook
Despite its best efforts, the Company notes that COVID-19 has the potential to significantly disrupt Centerra’s operations going forward and affect the Company’s future operating results. Among other things, COVID-19 has the potential to cause significant illness in the workforce, temporarily shut down mining, processing and other operations, and disrupt supply chains as well as rail and shipping networks used to deliver products to customers. While Centerra has taken and will continue to take measures to mitigate such risks, the global effects of COVID-19 are rapidly evolving and cannot be predicted.
2020 Production, Sales and Cost Guidance
Consolidated gold production in the first nine months of 2020 was 651,614 ounces and the full year guidance range of 740,000 to 820,000 ounces remains unchanged.
Centerra has reduced its consolidated 2020 guidance for production costs per ounce of gold sold to $410 to $460 per ounce and its guidance for all-in sustaining costs on a by-product basis per ounce soldNG to $740 to $790 per ounce from previously issued guidance of $450 to $500 per ounce and $820 to $870 per ounce, respectively, as a result of lower operating costs at the Mount Milligan and higher production at the Öksüt Mine.
Mount Milligan’s 2020 guidance for production costs per ounce of gold sold has been lowered to $730 to $780 per ounce and its all-in sustaining costs on a by-product basis per ounce soldNG has been reduced to $750 to $800 per ounce from previously issued guidance of $750 to $800 per ounce and $885 to $935 per ounce, respectively, due to decreased milling and mining costs.
Öksüt’s 2020 guidance for production costs per ounce of gold sold has been lowered to $345 to $395 per ounce and its guidance for all-in sustaining costs on a by-product basis per ounce soldNG has been reduced to $500 to $550 per ounce from previously issued guidance of $375 to $550 per ounce and $650 to $700 per ounce, respectively. This reduction is due to a combination of positive grade and tonne reconciliations, and effective cost control during this initial year of production.
In the fourth quarter of 2020, the Company expects higher all-in sustaining costs on a by-product basis per ounce soldNG as a result of lower levels of production at both the Kumtor and Öksüt Mines, whilst still planning to meet the Company’s full year production guidance range. At Kumtor, the Company is planning to process lower gold grade stockpiles and has a scheduled 5-day mill maintenance shutdown planned in December of 2020. In the fourth quarter of 2020 and into 2021, Kumtor will continue stripping cut-back 20 and processing lower gold grade stockpiles. Kumtor expects to access higher grade ore in cutback 20 in late 2021. The Öksüt Mine is expected to have lower levels of production in the fourth quarter of 2020, compared to the third quarter of 2020, due to the placement of lower gold grade ore on the heap leach, which is expected continue through the first half of 2021.
Centerra’s production forecast for the full year 2020 is maintained as follows:
| Units | Kumtor | Mount Milligan(1) | Öksüt | Centerra | |
| Gold | |||||
| Unstreamed Gold Payable Production guidance | (Koz) | 520-560 | 91-104 | 80-100 | 691-764 |
| Streamed Gold Payable Production guidance(1) | (Koz) | - | 49-56 | - | 49-56 |
| Total Gold Payable Production guidance(2) | (Koz) | 520-560 | 140-160 | 80-100 | 740-820 |
| First nine months of 2020 Gold Payable Production | (Koz) | 466 | 119 | 67 | 652 |
| Copper | |||||
| Unstreamed Copper Payable Production guidance | (Mlb) | - | 65-73 | - | 65-73 |
| Streamed Copper Payable Production guidance(1) | (Mlb) | - | 15-17 | - | 15-17 |
| Total Copper Payable Production guidance(3) | (Mlb) | - | 80-90 | - | 80-90 |
| First nine months of 2020 Copper Payable Production | (Koz) | - | 62 | - | 62 |
(1) The Mount Milligan Streaming Arrangement entitles Royal Gold to 35% and 18.75% of gold and copper sales, respectively, from the Mount Milligan Mine. Under the Mount Milligan Streaming Arrangement, Royal Gold will pay $435 per ounce of gold delivered and 15% of the spot price per metric tonne of copper delivered.
(2) Gold production assumes recoveries of 81.5% at Kumtor, 63% at Mount Milligan and approximately 60% at Öksüt.
(3) Copper production assumes 79% recovery for copper at Mount Milligan.
Centerra’s 2020 cost guidance ranges are updated to reflect changes to Mount Milligan, Öksüt, and to the Company’s consolidated estimates, as follows:
| Units | Kumtor | Mount Milligan | Öksüt | Centerra(2) | |||
| Production costs per ounce of gold sold | ($/oz) | $300-$360 | $730-$780 | $345-$395 | $410-$460 | ||
| All-in sustaining costs on a by-product basis guidance(1)(2) | ($/oz) | $750-$800 | $750-$800 | $500-$550 | $740-$790 | ||
| First nine months of 2020 All-in sustaining costs on a by-product basis (1)(2) | ($/oz) | $661 | $562 | $433 | $665 | ||
| Revenue-based tax and taxes(3) | ($/oz) | $190-$205 | $30-$40 | $20-$30 | $170-$180 | ||
| All-in sustaining costs on a by-product basis, including taxes (1), (2), (3) | ($/oz) | $940-$1,005 | $780-$840 | $520-$580 | $910-$970 | ||
| Gold - All-in sustaining costs on a co-product basis(1),(2) | ($/oz) | $750-$800 | $910-$1,010 | $500-$550 | $850-$900 | ||
| Production costs per pound of copper sold | ($/lb) | - | $1.10-$1.20 | - | $1.10-$1.20 | ||
| Copper - All-in sustaining costs on a co-product basis (1),(2) | ($/lb) | - | $1.35-$1.65 | - | $1.35-$1.65 | ||
(1) All-in sustaining costs on a by-product per ounce sold basis is a non-GAAP measure and is discussed under “Non-GAAP Measures”.
(2) Mount Milligan payable production and ounces sold are on a 100% basis (the Mount Milligan Streaming Arrangement entitles Royal Gold to 35% and 18.75% of gold and copper sales, respectively). Unit costs and consolidated unit costs include a credit for forecasted copper sales treated as by-product for all-in sustaining costs and all-in sustaining costs plus taxes. Payable production for copper and gold reflects estimated metallurgical losses resulting from handling of the concentrate and payable metal deductions, subject to metal content, levied by smelters.
(3) Includes revenue-based tax at Kumtor, British Columbia mineral tax at Mount Milligan and income tax at Öksüt.
2020 Capital Spending
Centerra’s 2020 guidance for capital spending, excluding capitalized stripping, remains unchanged at $192 million. Guidance for capitalized stripping has been reduced to $193 million from the previous guidance of $223 million, reflecting lower tonnes mined in the first nine months of the year at the Kumtor Mine due to longer waste haulage distances and a temporarily reduced workforce due to COVID-19.
Projected capital expenditures include:
| Capitalized | Sustaining | Growth | ||||||
| Projects ($ millions) | Stripping | Capital | Capital | Total | ||||
| Kumtor Mine(1) | 185 | 68 | 18 | 271 | ||||
| Mount Milligan Mine | - | 55 | - | 55 | ||||
| Öksüt Mine(1) | 8 | - | 29 | 37 | ||||
| Kemess Underground Project | - | - | 13 | 13 | ||||
| Other(2) | - | 9 | - | 9 | ||||
| Consolidated Total | $193 | $132 | $60 | $385 | ||||
(1) Capitalized stripping includes a cash component of $145 million (Kumtor Mine), and $8 million (Öksüt Mine).
(2) Thompson Creek Mine, Endako Mine (75% ownership), Langeloth facility, and Corporate.
Material Assumptions
Material assumptions or factors used to forecast production and costs for the fourth quarter of 2020 include the following:
- a gold price of $1,775 per ounce, up from $1,350 per ounce,
- a copper price of $2.65 per pound, up from $2.60 per pound,
- a molybdenum price of $9 per pound, down from $10.75 per pound.
- exchange rates:
- $1USD:$1.30 Canadian dollar (unchanged),
- $1USD:70.00 Kyrgyz som, up from $1USD:69.50 Kyrgyz som,
- $1USD:7.00 Turkish lira, up from $1USD:5.50 Turkish lira,
- $1USD:0.85 Euro (unchanged).
- diesel fuel price assumption:
- $0.41/litre at Kumtor, down from $0.50/litre,
- $0.70/litre (CAD$0.91/litre) at Mount Milligan, down from $0.81/litre (CAD$1.06/litre).
Material assumptions used in forecasting production and costs for the fourth quarter of 2020 can be found under the heading “Caution Regarding Forward-Looking Information” in this document. Production, cost and capital forecasts for the fourth quarter of 2020 are forward-looking information and are based on key assumptions and subject to material risk factors that could cause actual results to differ materially and which are discussed under the heading “Risks That Can Affect Our Business” in the Company’s most recent Annual Information Form.
Sensitivities
Centerra’s revenues, earnings and cash flows for the fourth quarter of 2020 are sensitive to changes in certain key inputs or currencies. The Company has estimated the impact of any such changes on revenues, net earnings and cash from operations. The sensitivities have been calculated considering the Company’s diesel and Canadian dollar hedges.
| Impact on ($ millions) | Impact on ($ per ounce sold) | |||||||
| Production Costs & Taxes | Capital Costs | Financing Costs | Revenues | Cash flows | Net Earnings (after tax) | AISC(2)(3) on by-product basis | ||
| Gold price | $50/oz | 0.6 - 1.1 | - | - | 4.0 - 7.7 | 3.4 - 6.6 | 3.4 - 6.6 | 0.46 - 0.48 |
| Copper price | 10% | 1.1 - 1.7 | - | - | 4.0 - 6.1 | 2.9 - 4.4 | 2.9 - 4.4 | 29.4 - 56.2 |
| Diesel fuel(4) | 10% | 0.7- 0.9 | - | - | - | 0.7- 0.9 | 0.7- 0.9 | 4.8 - 9.1 |
| Kyrgyz som(1) | 1 som | 0.1 - 0.2 | - | - | - | 0.1 - 0.2 | 0.1 - 0.2 | 0.9 - 1.7 |
| Canadian dollar(1)(4) | 10 cents | 1.7 - 2.0 | 0.3 - 0.4 | - | - | 2.0 - 2.4 | 1.7 - 2.0 | 9.0 - 17.2 |
| Turkish lira(1) | 1 lira | 0.5 - 1.0 | 0.5 - 1.0 | - | - | 1.0 - 2.0 | 0.5 - 1.0 | 4.5 - 8.7 |
(1) Appreciation of currency against the U.S. dollar will result in higher costs and lower cash flow and earnings, depreciation of currency against the U.S. dollar results in decreased costs and increased cash flow and earnings.
(2) Non-GAAP measure. See discussion under “Non-GAAP Measures”.
(3) All-in sustaining costs is calculated over the fourth quarter of the year ounces sold forecast.
(4) Includes the effect of hedging programs.
Financial Performance
Third Quarter 2020 compared to Third Quarter 2019
Revenue:
Revenue of $515 million was recognized in the third quarter of 2020 compared to $388 million in the third quarter of 2019. The increase in revenue was due to 31% higher average realized gold prices, 29% higher average realized copper prices and 51,120 gold ounces sold at Öksüt in 2020, partially offset by lower gold ounces sold at Kumtor and lower gold ounces and copper pounds sold at Mount Milligan due to mine plan sequencing.
Production:
Gold production was 241,448 ounces in the third quarter of 2020 compared to 205,660 ounces in the third quarter of 2019. Gold production in the third quarter of 2020 was 140,182 ounces at Kumtor, 49,854 ounces at Mount Milligan and 51,412 ounces at Öksüt. At Kumtor and at Mount Milligan, the 7% and 10% decrease, respectively, was due to lower grades and recoveries at both sites due to sequencing, while Öksüt only commenced production in 2020.
Copper production at Mount Milligan was 23.3 million pounds in the third quarter of 2020 compared to 21.2 million pounds in the third quarter of 2019. The increase in copper production was due to higher throughput as the mine achieved an average throughput of 57,873 tonnes per calendar day in the quarter, combined with higher copper grades.
Production costs per ounce of gold sold:
Production costs per ounce of gold sold were $386 per ounce in the third quarter of 2020 compared to $467 per ounce in the third quarter of 2019. The decrease was primarily due to a planned mill shutdown that occurred in the third quarter of 2019. The decrease was also as a result of decreased water sourcing costs at Mount Milligan. Consolidated production costs per ounce was further impacted by the addition of production from Öksüt in 2020, at a production cost per ounce of gold sold of $354 per ounce in the third quarter of 2020.
All-in sustaining costs on a by-product basis per ounce soldNG:
All-in sustaining costs on a by-product basis per ounce soldNG, which excludes revenue-based tax and income tax were $528 per ounce in the third quarter of 2020 compared to $666 per ounce in the third quarter of 2019. The decrease in all-in sustaining costs on a by-product basis per ounce soldNG was due to higher consolidated gold ounces sold, lower production costs and higher copper credits, partially offset by higher capitalized stripping costs at Kumtor. Higher consolidated gold ounces sold was due to the ounces sold at Öksüt which recognized all-in sustaining costs on a by-product basis per ounce soldNG of $416 per ounce.
Exploration:
Exploration expenditures of $11.7 million were recognized in the third quarter of 2020 compared to $7.6 million in the third quarter of 2019. The increase was primarily due to additional brownfield exploration activity carried out at Kumtor and at Mount Milligan.
Financing costs:
Financing costs of $2 million were recognized in the third quarter of 2020 compared to $3.4 million in the third quarter of 2019. The decrease was primarily due to lower costs on the Company’s $500 million revolving credit facility which remains undrawn and on the promissory note with Caterpillar Financial Services Limited which was repaid in the fourth quarter of 2019.
Corporate administration:
Corporate administration costs of $6.4 million were recognized in the third quarter of 2020 compared to a charge of $12.7 million in the third quarter of 2019. The decrease of $6.3 million was due to a decrease in share-based compensation, impacted primarily by the Company’s share price which increased by 24% in the third quarter of 2019 while the share price was static in the current quarter of 2020. Corporate administration costs, excluding share-based compensation, remained consistent between 2020 and 2019.
First Nine Months 2020 compared to First Nine Months 2019
Revenue:
Revenue of $1,302 million was recognized in the first nine months of 2020 compared to $1,063 million in the first nine months of 2019. The increase was due to a 28% higher average realized gold price, 8% more gold ounces sold and 16% more copper pounds sold.
Production:
Gold production was 651,614 ounces in the first nine months of 2020 compared to 588,802 ounces in the first nine months of 2019. Gold production in the first nine months of 2020 was 465,734 ounces at Kumtor, 119,191 ounces at Mount Milligan and 66,689 ounces at Öksüt. At Kumtor, the 3% increase in gold production was due to higher throughput and more gold produced from carbon fines. At Mount Milligan, the 13% decrease in ounces produced was due to lower grades and lower recoveries, partially offset by higher throughput. Öksüt commenced production in 2020.
Copper production at Mount Milligan was 62.4 million pounds in the first nine months of 2020 compared to 53.1 million in the first nine months of 2019. The increase was due to higher throughput and higher grades, partially offset by lower recoveries.
Production costs per ounce of gold sold:
Production costs per ounce of gold sold were $406 per ounce in the first nine months of 2020 compared to $469 per ounce in the first nine months of 2019. The decrease in 2020 was mainly due to lower processing costs per tonne at Kumtor, which was impacted by the deferral of a mill shutdown, lower mining and processing costs at Mount Milligan and greater consolidated gold ounces sold. The increase in consolidated gold ounces sold were due to the ounces sold at Öksüt which recognized production costs of $360 per ounce.
All-in sustaining costs on a by-product basis per ounce soldNG:
All-in sustaining costs on a by-product basis per ounce soldNG, which excludes revenue-based tax and income tax were $665 per ounce in the first nine months of 2020 compared to $683 per ounce in the first nine months of 2020. The decrease was due to lower processing costs per tonne at Kumtor and Mount Milligan and increased copper credits at Mount Milligan, partially offset by higher capitalized stripping costs at Kumtor. All-in sustaining costs on a by-product basis per ounce soldNG at Öksüt were $433.
Exploration:
Exploration expenditures of $26.1 million were recognized in the first nine months of 2020 compared to $18.9 million in the first nine months of 2019. The increase was due to additional brownfield exploration activity including additional drilling costs of $3.4 million at Kumtor and $0.9 million at Mount Milligan.
Financing costs:
Financing costs of $9.5 million were recognized in the first nine months of 2020 compared to $11.1 million in the first nine months of 2019. The decrease was primarily due to lower costs on the Company’s $500 million revolving credit facility which was undrawn in the third quarter of 2020, lower costs on the Öksüt project financing facility which was repaid in full and cancelled in the first quarter of 2020, and the repayment of the promissory note with Caterpillar Financial Services Limited in the fourth quarter of 2019.
Corporate administration:
Corporate administration costs were $28.3 million in the first nine months of 2020 compared to $36.1 million in the first nine months of 2019. The decrease was primarily due to lower share-based compensation of $7 million as a result of a fair value adjustment, as well as lower corporate activities in 2020. Corporate administration costs, excluding share-based compensation, remained consistent between 2020 and 2019.
Balance Sheet Review
| As at | |||
| $ millions | September 30, 2020 | December 31, 2019 | % Change |
| Consolidated: | |||
| Cash | 484.2 | 42.7 | 1034% |
| Inventories | 622.4 | 774.1 | (20%) |
| Other current assets | 69.7 | 115.9 | (40%) |
| Property, plant and equipment | 1,734.1 | 1,669.5 | 4% |
| Other non-current assets | 81.4 | 99.5 | (18%) |
| Total Assets | 2,991.8 | 2,701.7 | 11% |
| Current liabilities | 252.7 | 244.8 | 3% |
| Non-current Debt | - | 70.0 | (100%) |
| Provision for reclamation | 314.2 | 265.2 | 18% |
| Other non-current liabilities | 54.5 | 55.9 | (3%) |
| Total Liabilities | 621.4 | 635.9 | (2%) |
| Total Equity | 2,370.4 | 2,065.8 | 15% |
| Total Liabilities and Equity | 2,991.8 | 2,701.7 | 11% |
Cash
Cash as at September 30, 2020 was $484.2 million compared to $42.7 million as at December 31, 2019. The increase was due to free cash flowNG of $526.9 million in the first nine months of 2020 and the release of $25 million of restricted cash after repaying and cancelling the Öksüt project financing facility. This was partially offset by the repayment in full of the outstanding balance on the Company’s $500 million revolving credit facility and former Öksüt project financing facility.
Inventory
Total inventory as at September 30, 2020 was $622.4 million compared to $774.1 million as at December 31, 2019. Total inventory includes stockpiles of ore, gold in-circuit, gold doré, copper and gold concentrate and molybdenum inventory (collectively “Product Inventory”) of $405.9 million and supplies inventory of $216.5 million, compared to $564.7 million and $209.4 million, respectively, as at December 31, 2019. The decrease in product inventory was primarily attributable to Kumtor’s 2020 production coming from ore stockpiles at Kumtor.
As at September 30, 2020, the product inventory balance consisted of 582,041 contained gold ounces on surface at Kumtor, of which roughly 21% is expected to be processed in the fourth quarter of 2020, 78,800 contained gold ounces and 19.4 million contained pounds of copper in stockpiles at Mount Milligan, of which roughly 5% is expected to be processed in the fourth quarter of 2020 and 70,209 contained ounces on surface, stacked and in-circuit at Öksüt, of which roughly 55% is expected to be processed in the last quarter of 2020.
Property, Plant and Equipment
The book value of property, plant and equipment as at September 30, 2020 was $1.73 billion compared to $1.67 billion as at December 31, 2019. The increase in the first nine months of 2020 was mainly related to capitalized stripping costs at Kumtor and construction costs at Öksüt.
Asset Retirement Obligations
Asset retirement obligations as at September 30, 2020 were $314.2 million compared to $265.2 million as at December 31, 2019. The increase was primarily due to a reduction in the discount rates used to calculate the present value of reclamation costs at the Company’s various sites.
In 1998, a reclamation trust fund was established to cover the future costs of reclamation, net of salvage values at the Kumtor Mine. As at September 30, 2020, this fund had a balance of $47 million and is shown as long-term asset on the balance sheet.
Debt
Total bank debt as at September 30, 2020 was nil compared to $70 million as at December 31, 2019. The Company’s $500 million revolving credit facility was undrawn as at September 30, 2020 and December 31, 2019.
The Company repaid the outstanding balance of $77.5 million on the Öksüt project financing facility and subsequently cancelled the facility in the first quarter of 2020. This resulted in the release of $25 million in restricted cash.
Liquidity
The Company believes its cash on hand, cash flow from the Company’s Kumtor, Mount Milligan and Öksüt operations and available capacity in its existing corporate $500 million revolving credit facility will be sufficient to satisfy working capital needs, fund its development activities and meet other liquidity requirements through to the end of 2020. See “Caution Regarding Forward-Looking Information”.
Market Conditions
Commodity prices
The Company's profitability is materially affected by the market price of metals; metal prices fluctuate widely and are affected by numerous factors beyond the Company's control.
| Average spot price | Period end spot price | ||||||||||||||
| Three months ended September 30 | Nine months ended September 30 | September 30, | December 31, | ||||||||||||
| Metal | 2020 | 2019 | %Change | 2020 | 2019 | %Change | 2020 | 2019 | %Change | ||||||
| Gold (per oz) | $ | 1,911 | $ | 1,474 | 30% | $ | 1,737 | $ | 1,363 | 27% | $ | 1,886 | $ | 1,517 | 24% |
| Copper (per lb) | 2.93 | 2.62 | 12% | 2.64 | 2.73 | (3%) | 3.03 | 2.80 | 8% | ||||||
| Molybdenum (per lb) | 7.71 | 11.83 | (35%) | 8.57 | 11.93 | (28%) | 8.15 | 9.20 | (11%) | ||||||
Foreign Exchange
The Company receives its revenue through the sale of gold, copper and molybdenum in U.S. dollars. The Company has operations in Canada, including its corporate head office, the Kyrgyz Republic, Turkey and the United States.
A chart accompanying this announcement is available at
https://www.globenewswire.com/NewsRoom/AttachmentNg/b8020035-29e0-4cbb-8574-369c4261c112
| Average exchange rate | Period end exchange rate | ||||||||||||||
| Three months ended September 30 | Nine months ended September 30 | September 30, | December 31, | ||||||||||||
| Currency | 2020 | 2019 | %Change | 2020 | 2019 | %Change | 2020 | 2019 | %Change | ||||||
| USD-CAD | $ | 1.33 | $ | 1.32 | 1% | $ | 1.35 | $ | 1.33 | 2% | $ | 1.33 | $ | 1.3 | 2% |
| USD-Kyrgyz Som | 78.1 | 70.2 | 11% | 75.7 | 70.1 | 8% | 80 | 69.8 | 15% | ||||||
| USD-Turkish Lira | 7.2 | 5.7 | 26% | 6.7 | 5.6 | 20% | 7.7 | 6.0 | 28% | ||||||
The Company utilizes its foreign exchange hedging program in order to manage its exposure to adverse fluctuations in the Canadian dollar, relative to the U.S dollar, see “Financial Instruments”. The Company does not currently hedge the Kyrgyz som or Turkish lira.
Diesel Fuel Prices
Fuel costs represent a significant cost component for Centerra’s mining operations, representing 10% of production costs. Prices for Kumtor’s diesel fuel generally reflect the price movements of Brent crude oil. Kumtor sources its fuel from Russia either directly or through Kyrgyz distributors and prices include additional costs such as seasonal premiums for winterizing fuel and transportation costs from the Russian refineries.
| Average spot price | Period end spot price | ||||||||||||||
| Three months ended September 30 | Nine months ended September 30 | September 30, | December 31, | ||||||||||||
| Commodity | 2020 | 2019 | % Change | 2020 | 2019 | % Change | 2020 | 2019 | % Change | ||||||
| Kumtor Diesel (per ltr) | $ | 0.37 | $ | 0.49 | -24% | $ | 0.4 | $ | 0.51 | (22%) | $ | 0.38 | $ | 0.49 | (22%) |
| ULSD (per bbl) | 50.48 | 79.58 | -37% | 52.02 | 81.4 | (36%) | 48.11 | 85.19 | (44%) | ||||||
| Brent (per bbl) | 43.34 | 62.03 | -30% | 42.53 | 64.75 | (34%) | 40.95 | 66.00 | (38%) | ||||||
The Company utilizes its diesel hedging program in order to manage its exposure to adverse fluctuations in diesel fuel prices, see “Financial Instruments”.
Financial Instruments
The Company seeks to manage its exposure to fluctuations in diesel fuel prices, commodity prices and foreign exchange rates by entering into derivative financial instruments from time-to-time.
The hedge positions for each of these programs as at September 30, 2020 are summarized as follows:
| Settlements | As at September 30, 2020 | ||||||||
| Program | Instrument | Unit | Average strike price | Type | 2020 | 2021 | 2022 | Total position (4) | Fair value ($'000's) |
| FX Hedges | |||||||||
| USD/CAD zero-cost collars(3) | CAD | 1.33/1.39 | Fixed | 48.0 million | 190.8 million | 137.0 million | 375,800,000 | 4,116 | |
| USD/CAD forward contracts(2) | CAD | 1.38 | Fixed | 45.0 million | 102.0 million | 10.0 million | 157,000,000 | 4,763 | |
| Fuel Hedges | |||||||||
| Brent Crude Oil zero-cost collars(1) | Barrels | $44/$50 | Fixed | 79,090 | 79,712 | 79,966 | 238,768 | -1,171 | |
| Brent Crude Oil swap contracts(2) | Barrels | $43 | Fixed | - | 206,485 | 18,850 | 225,335 | 413 | |
| ULSD zero-cost collars(1) | Barrels | $60/$67 | Fixed | 94,391 | 56,404 | 94,966 | 245,761 | -3,050 | |
| ULSD swap contracts(2) | Barrels | $55 | Fixed | 30,000 | 231,655 | 33,850 | 295,505 | -576 | |
| Gold/Copper Hedges (Royal Gold deliverables): | |||||||||
| Gold forward contracts(2) | Ounces | N/A(4) | Float | 26,010 | - | - | 26,010 | 236 | |
| Copper forward contracts(2) | Pounds | N/A(4) | Float | 6.5 million | - | - | 6,549,926 | 511 | |
(1) Under the fuel zero-cost collars, the Company retains the right to buy fuel barrels at the contract’s ‘ceiling’ price if the market price was to exceed this price upon contract expiration, while requiring the Company to buy fuel barrels at the ‘floor’ price if the market price fell below this price upon expiration. At the end of each contract there is no exchange of the underlying item and the contract is financially settled.
(2) Under the swap and forward contracts, the Company ‘buy’ and ‘sell’ metals, currencies and commodities, at a specified price at a certain future date.
(3) Under the currency zero-cost collars, the Company retains the right to buy foreign currency at the contract’s ‘floor’ price if the market price was to fall below this price upon contract expiration, while requiring it to buy foreign currency at the ‘ceiling’ price if the market price was to exceed this price upon expiration.
(4) Royal Gold hedging program with a market price determined on closing of the contract.
In the third quarter and first nine months of 2020, Centerra’s Canadian dollar hedging program resulted in a $1.8 million realized gain and $1.6 million realized loss, respectively, compared to nil for both the third quarter and first nine months of 2019. As at September 30, 2020, the Company has hedged 69% of the estimated Canadian dollar exposure for the remainder of 2020, using zero cost collars and forwards, 53% of the estimated 2021 exposure and 37% of the exposure for the first nine months of 2022.
In the third quarter of 2020, Centerra’s diesel hedging program resulted in a $1.3 million realized loss compared to a $0.1 million realized gain in the third quarter of 2019. In the first nine months of 2020, Centerra’s diesel hedging program resulted in a $3.5 million realized loss compared to a $0.7 million realized gain in the first nine months of 2019. As at September 30, 2020, the Company has hedged 87% of the estimated diesel fuel exposure for the remainder of 2020, 58% of the 2021 estimated exposure and 31% of the exposure for the first nine months of 2022 using zero cost collars and swaps.
Centerra does not enter into off-balance sheet arrangements with special purpose entities in the normal course of its business, nor does it have any unconsolidated affiliates.
Operating Mines and Facilities
Kumtor Mine
The Kumtor open pit mine, located in the Kyrgyz Republic, is one of the largest gold mines in Central Asia. It has been in production since 1997 and has produced over 13.1 million ounces of gold to September 30, 2020.
Kyrgyz Republic
Despite political and social disruption in the Kyrgyz Republic following its recent Parliamentary election held during the first week of October 2020, operations at the Kumtor Mine continue. Mining and gold production continue at targeted rates, and regular gold shipments are being made. No disruptions have occurred to the mine’s supply chain as borders are open for cargo and customs is functioning normally.
The Company understands that other mining companies within the Kyrgyz Republic experienced property damage and interruption in their operations in connection with protests that occurred following the October 4, 2020 parliamentary elections. While Kumtor did not experience any material issues at its offices or mine site, the Company and Kumtor will continue to remain on alert. The Company is monitoring the situation and is taking all the necessary precautions to ensure the safety of its personnel and operations. Centerra and Kumtor will continue to cooperate and work with the Kyrgyz Government and state agencies to ensure uninterrupted operation of the mine.
An interim government led by Prime Minister Sadyr Japarov has been installed in the Kyrgyz Republic and, following the resignation of former President Sooronbai Jeenbekov, Mr. Japarov is also acting President. The Company further understands that new presidential elections have been scheduled for January 10, 2021 but that new parliamentary elections are yet to be scheduled.
COVID-19 update
Kumtor continues to implement mitigation controls and health & safety precautions at the mine site to contain the spread of COVID-19. As previously noted, the Company observed an effect on the availability of Kumtor’s workforce due to a greater rate of COVID-19 infections and other illnesses in the Kyrgyz Republic. As a result, open pit mining began operating at less than full capacity in July, but returned to full capacity in September. Mill processing operations continue to work at full capacity throughout the quarter and are expected to maintain gold production by processing stockpiles as originally planned for the year.
It should be noted that in October 2020, there has been a significant increase in reported COVID-19 cases in the Kyrgyz Republic that may result in subsequent changes to operational plans.
Kumtor Technical Report Update
The Company continues to carry out further required technical work on the Kumtor life of mine plan, including with respect to mining costs, recoveries and waste rock stability assessments in view of the fatal accidents that occurred at the Lysii Waste Rock Dump in December 2019. Once that technical work has been completed, the Company expects to be in a position to release a new technical report for the Kumtor Mine. At the same time, the Company is continuing to monitor the ongoing political developments in the Kyrgyz Republic and to assess the risks associated with the further potential investments in the Kumtor Mine.
Kumtor Operating Results
| Unaudited ($ millions, except as noted) | Three months ended September 30, | Nine months ended September 30, | ||||||||
| Financial Highlights: | 2020 | 2019 | % Change | 2020 | 2019 | % Change | ||||
| Revenue | $ | 268.2 | $ | 234.5 | 14% | $ | 803.5 | $ | 627.0 | 28% |
| Production costs | 46.3 | 64.7 | (28%) | 152.5 | 179.0 | (15%) | ||||
| Depreciation, depletion and amortization | 52.5 | 50.1 | 5% | 170.9 | 134.7 | 27% | ||||
| Earnings from mine operations | $ | 169.4 | $ | 119.7 | 42% | $ | 473.4 | $ | 313.3 | 51% |
| Cash provided by mine operations | 208.3 | 14.4 | 1347% | 562.9 | 227.1 | 148% | ||||
| Cash provided by mine operations before changes in working capital | 174.9 | 119.9 | 46% | 506.7 | 335.6 | 51% | ||||
| Free cash flow from mine operations (deficit) (1) | 157.3 | (21.0) | (849%) | 409.8 | 135.7 | 202% | ||||
| Operating Highlights: | ||||||||||
| Tonnes mined (000's) | 17,927 | 38,731 | (54%) | 61,001 | 127,874 | (52%) | ||||
| Tonnes ore mined (000's) | 5 | 4,748 | (100%) | 590 | 9,255 | (94%) | ||||
| Average mining grade (g/t) | 1.22 | 3.08 | (61%) | 7.66 | 2.43 | 215% | ||||
| Tonnes processed (000's) | 1,590 | 1,496 | 6% | 4,760 | 4,647 | 2% | ||||
| Average process plant head grade (g/t) | 3.48 | 3.78 | (8%) | 3.65 | 3.66 | (0%) | ||||
| Process plant Recovery (%)(2) | 80.3% | 84.8% | (5%) | 82.8% | 83.0% | (0%) | ||||
| Mining costs - total ($/t mined material) | 1.76 | 1.32 | 34% | 1.72 | 1.21 | 42% | ||||
| Processing costs ($/t milled material) | 10.97 | 12.32 | (11%) | 11.01 | 11.57 | (5%) | ||||
| Gold produced (ounces) | 140,182 | 150,305 | (7%) | 465,734 | 451,679 | 3% | ||||
| Gold sold (ounces) | 142,132 | 160,088 | (11%) | 472,572 | 463,663 | 2% | ||||
| Average realized gold price ($/oz sold)(1) | 1,887 | 1,464 | 29% | 1,700 | 1,352 | 26% | ||||
| Capital Expenditures - sustaining | 9.7 | 10.5 | (7%) | 42.7 | 30.8 | 39% | ||||
| Capital Expenditures - growth | 3.4 | 6.6 | (49%) | 7.4 | 13.1 | (44%) | ||||
| Capital Expenditures - stripping - cash | 29.4 | 18.9 | 56% | 94.4 | 48.3 | 95% | ||||
| Capital Expenditures - stripping - non-cash | 9.1 | 4.7 | 93% | 29.6 | 13.7 | 116% | ||||
| Capital Expenditures - total | 51.6 | 40.8 | 27% | 174.2 | 106.0 | 64% | ||||
| Unit Costs: | ||||||||||
| Production costs per ounce of gold sold | $ | 326 | $ | 404 | (19%) | $ | 323 | $ | 386 | (16%) |
| Gold - All-in sustaining costs on a by-product basis ($/oz sold)(1) | $ | 639 | $ | 626 | 2% | $ | 661 | $ | 581 | 14% |
| Gold - All-in sustaining costs on a by-product basis - including taxes ($/oz sold)(1) | $ | 905 | $ | 832 | 9% | $ | 901 | $ | 771 | 17% |
(1) Non-GAAP measure. See discussion under “Non-GAAP Measures”.
(2) Metallurgical recoveries are based on recovered gold, not produced gold.
Third Quarter 2020 compared to Third Quarter 2019
Earnings from mine operations of $169.4 million were recognized in the third quarter of 2020 compared to earnings from mine operations of $119.7 million in the third quarter of 2019. The increase was primarily due to a 29% higher average realized gold price, lower production costs and lower costs related to the settlement of the Strategic Agreement, partially offset by 11% less ounces sold and higher depreciation charges.
A chart accompanying this announcement is available at
https://www.globenewswire.com/NewsRoom/AttachmentNg/1704a64d-582d-41b3-b80c-b33baaacf2ff
Cash provided by mine operations of $208.3 million was recognized in the third quarter of 2020 compared to $14.4 million in the third quarter of 2019. The increase was primarily due to higher proceeds from gold sales as a result of higher realized gold prices, the material payments made in 2019 pursuant to the Kumtor Strategic Agreement, timely collection of sales and a higher draw down of product inventory. Free cash flow from mine operationsNG of $157.3 million was recognized in the third quarter of 2020 compared to a deficit of $21 million in the third quarter of 2019. The increase was due to an increase in cash provided by mine operations, partially offset by an increase in capitalized stripping.
In July 2020, Kumtor received a permit to utilize the Lysii Valley for dumping waste rock going forward. Lysii Valley is expected to be the main mine waste rock dump for the next two years as it is closest to cut back 20. Construction and preparation of haul roads were completed in the third quarter. According to the new waste dumping plan in the Lysii Valley, waste rock will be placed at the base of the valley initially and the waste rock dump will be developed up the valley creating slightly longer haulage distances in the near-term.
During the third quarter of 2020, Kumtor continued stripping from cut-back 20. Tonnes mined were 17.9 million in the third quarter of 2020 compared to 38.7 million tonnes in the third quarter of 2019. The decrease was primarily due to longer haulage distances as a result of the change in waste rock dump location from the Lysii Valley to the Central Valley and lower equipment utilization due to reduced workforce availability. The 17.9 million tonnes mined in the third quarter of 2020 were capitalized as waste stripping for the benefit of future production from cut-back 20.
Mining costs per tonne were $1.76 in the third quarter of 2020 compared to $1.32 in the third quarter of 2019. The increase was primarily due to lower tonnes mined and longer haulage distances, partially offset by lower diesel fuel prices and a favourable foreign exchange rate movement. Of the $31.6 million in mining costs, $29.4 million was capitalized in the third quarter of 2020, compared to $51.1 million in mining costs of which $18.9 million was capitalized in the third quarter of 2019.
Gold production was 140,182 ounces from on-surface stockpiled ore in the third quarter of 2020 compared to 150,305 ounces of gold in the third quarter of 2019. The decrease was primarily due to lower process plant head grade and lower gold recovery. During the third quarter of 2020, Kumtor’s average process plant head grade was 3.48 g/t with a recovery of 80.3% compared to 3.78 g/t and a recovery of 84.8% in the third quarter of 2019.
Processing costs per tonne were $10.97 in the third quarter of 2020 compared to $12.32 in the third quarter of 2019. The decrease was primarily due to a planned mill shutdown that occurred in the third quarter of 2019, a similar shutdown has been deferred to the fourth quarter 2020, higher tonnes processed, and a favourable foreign exchange rate movement. This was partially offset by increased costs associated with the increased carbon fine production.
Production costs per ounce of gold sold were $326 per ounce in the third quarter of 2020, compared to $404 in the third quarter of 2019. The decrease was primarily due to lower processing costs per tonne, and a significant decrease in the amount of ore being mined at Kumtor, resulting in higher costs capitalized as stripping and charged to depreciation.
A chart accompanying this announcement is available at
https://www.globenewswire.com/NewsRoom/AttachmentNg/5b59730b-b0b4-4f1a-bc60-8fa97c672bb6
All-in sustaining costs on a by-product basis per ounce soldNG, which excludes revenue-based tax, were $639 per ounce in the third quarter of 2020 compared to $626 per ounce in the third quarter of 2019. The increase was primarily due to lower ounces sold and greater capitalized stripping costs as mining activities were concentrated on stripping cut-back 20, partially offset by lower production costs.
All-in sustaining costs on a by-product basis per ounce sold including taxesNG were $905 per ounce in the third quarter of 2020 compared to $832 per ounce in the third quarter of 2019.
First Nine Months 2020 compared to First Nine Months 2019
Earnings from mine operations of $473.4 million were recognized in the first nine months of 2020 compared to $313.3 million in the first nine months of 2019. The increase was primarily due to 26% higher average realized gold prices, 2% more ounces sold and lower production costs, partially offset by greater depreciation charges which largely represents capitalized stripping cost being amortized into earnings as stockpiled inventories were processed through the mill during the year.
A chart accompanying this announcement is available at
https://www.globenewswire.com/NewsRoom/AttachmentNg/6d12999b-279e-407c-a23c-2bb49c935a02
Cash provided by mine operations of $562.9 million was recognized in the first nine months of 2020 compared to $227.1 million in the in the first nine months of 2019. The increase was due to greater earnings from mine operations, an increase in cash generated from working capital as the process plant processed from on surface stockpiled ore and lower Strategic Agreement payments. Free cash flow from mine operationsNG of $409.8 million was recognized in the first nine months of 2020 compared to $135.7 million in the first nine months of 2019. The increase was due to an increase in cash provided by mine operations, partially offset by higher capitalized expenditures, as Kumtor added 11 trucks to its fleet to increase mining capacity, and higher capitalized stripping costs, as Kumtor mined cut-back 20 though the year.
During the first nine months of 2020, mining operations restarted in January following the Lysii waste rock dump incident, Kumtor finished mining cut-back 19 West and the SB Zone and continued stripping and managing the ice from cut-back 20. Tonnes mined were 61 million in the first nine months of 2020 compared to 127.9 million tonnes in the first nine months of 2019. The decrease was primarily due to the suspension of mining operations from December 2019 to mid-January 2020, longer haulage distances as a result of the change in the waste dump location from the Lysii Valley to the Central Valley and lower equipment utilization due to workforce availability. Of the 61 million tonnes mined in the first nine months of 2020, 59 million tonnes were capitalized as waste stripping for future production from cut-back 20.
Mining costs per tonne were $1.72 in the first nine months of 2020 compared to $1.21 in the first nine months of 2019. The increase was primarily due to lower tonnes mined, and longer haulage distances, partially offset by lower diesel fuel prices and a favourable foreign exchange rate movement. Of the $105 million in mining costs, $94.4 million was capitalized in the first nine months of 2020, compared to $154.8 million in mining costs of which $48.3 million was capitalized in the first nine months of 2019.
Gold production was 465,734 ounces of gold in the first nine months of 2020 from previously mined on-surface stockpiled ore, compared to 451,679 ounces of gold in the first nine months of 2019. The increase was primarily due to higher throughput, more gold produced from carbon fines and higher gold extraction from the additional treatment of the effluent plant water. This increase was partially offset by lower process plant head grade and lower gold recovery. During the first nine months of 2020, Kumtor’s average process plant head grade was 3.65 g/t with a recovery of 82.8% compared to 3.66 g/t and a recovery of 83.0% in the first nine months of 2019.
Processing costs per tonne were $11.01 per tonne in the first nine months of 2020 compared to $11.57 per tonne in the first nine months of 2020. The decrease was primarily due to lower process plant equipment costs as a result of a planned mill shutdown that occurred in the third quarter of 2019, a similar shutdown has been deferred to the fourth quarter 2020, higher tonnes processed, a favourable foreign exchange rate movement and lower electricity costs. This was partially offset by increased costs associated with the increased carbon fine production.
Production costs per ounce of gold sold were $323 per ounce in the first nine months of 2020 compared to $386 per ounce in the first nine months of 2019. The decrease was primarily due to lower processing costs per tonne, and a significant decrease in the amount of ore being mined at Kumtor, resulting in higher costs capitalized as stripping and charged to depreciation.
A chart accompanying this announcement is available at
https://www.globenewswire.com/NewsRoom/AttachmentNg/524e5392-2f9b-40be-a906-06a5df9821e1
All-in sustaining costs on a by-product basis per ounce soldNG, which excludes revenue-based tax were $661 per ounce in the first nine months of 2020 compared to $581 per ounce in the first nine months of 2019. The increase was mainly due to higher capitalized stripping costs, the purchase of eleven trucks to increase the mining capacity of the mine and higher Strategic Agreement contributions to the various funds in the Kyrgyz Republic in the prior period. This was partially offset by an increase in ounces sold and lower operating costs.
All-in sustaining costs on a by-product basis per ounce sold including taxesNG were $901 per ounce in the first nine months of 2020 compared to $771 per ounce in the first nine months of 2019.
Mount Milligan Mine
The Mount Milligan Mine is an open pit mine located in north central British Columbia, Canada producing a gold and copper concentrate. Production at Mount Milligan is subject to an arrangement with RGLD Gold AG and Royal Gold, Inc. (together, “Royal Gold”) pursuant to which Royal Gold is entitled to purchase 35% of the gold produced and 18.75% of the copper production at the Mount Milligan Mine for $435 per ounce of gold delivered and 15% of the spot price per metric tonne of copper delivered (the “Mount Milligan Streaming Arrangement”).
Water Update
Stored water inventory at Mount Milligan, which is critical to the ability to process ore through the mill on a sustainable basis, was in excess of 7 million cubic metres as at September 30, 2020. The Company does not expect any interruptions to Mount Milligan operations in the medium term when considering available water inventory.
Spring water pumping began in April 2020 and continued through to July 12 when the permit limit of 4.5 million cubic metres was reached at Rainbow Creek. Additional water was pumped from Philip Lake during the quarter. Through the quarter, Mount Milligan continued to access ground water from the Lower Rainbow Valley wellfield as well as other groundwater wells near the tailings storage facility.
Exploration activities continue to focus on extending the groundwater capacity in the vicinity of the existing infrastructure. The Company continues to pursue a longer-term solution to its water requirements at Mount Milligan and is in discussions with regulators, its First Nations partners and other stakeholders.
A chart accompanying this announcement is available at
https://www.globenewswire.com/NewsRoom/AttachmentNg/2828f830-a204-49e1-838d-0102b7e8dc91
COVID-19
During the third quarter of 2020, there have been no COVID-19 confirmed cases onsite and only one confirmed case on a year to date basis, though several employees have been sent home with COVID-19 related symptoms in accordance with Mount Milligan’s protocols. The site continues to monitor controls that have been put in place and has added to these controls as required.
Mount Milligan Operating Results
| Unaudited ($ millions, except as noted) | Three months ended September 30, | Nine months ended September 30, | ||||||||
| Financial Highlights: | 2020 | 2019 | % Change | 2020 | 2019 | % Change | ||||
| Gold revenue | 64.1 | 62.3 | 3% | 158.3 | 156.3 | 1% | ||||
| Copper revenue | 52.8 | 41.4 | 28% | 125.6 | 108.9 | 15% | ||||
| Total Revenues | $ | 116.9 | $ | 103.7 | 13% | $ | 283.9 | $ | 265.2 | 7% |
| Production costs | 48.0 | 61.5 | (22%) | 161.6 | 183.6 | (12%) | ||||
| Depreciation, depletion and amortization | 20.7 | 15.9 | 31% | 56.7 | 42.3 | 34% | ||||
| Earnings from mine operations | $ | 48.2 | $ | 26.3 | 83% | $ | 65.6 | $ | 39.3 | 67% |
| Cash provided by mine operations | 70.4 | 38.7 | 82% | 141.3 | 76.6 | 84% | ||||
| Cash provided by mine operations before changes in working capital | 61.7 | 36.6 | 69% | 102.8 | 65.7 | 56% | ||||
| Free cash flow from mine operations(1) | 63.1 | 31.5 | 100% | 119.5 | 49.9 | 139% | ||||
| Operating Highlights: | ||||||||||
| Tonnes mined (000's) | 11,305 | 10,637 | 6% | 30,304 | 29,889 | 1% | ||||
| Tonnes ore mined (000's) | 5,016 | 4,948 | 1% | 13,845 | 11,924 | 16% | ||||
| Tonnes milled (000's) | 5,324 | 5,127 | 4% | 14,568 | 12,431 | 17% | ||||
| Process plant Head Grade Copper (%) | 0.26% | 0.25% | 6% | 0.26% | 0.25% | 4% | ||||
| Process plant Head Grade Gold (g/t) | 0.47 | 0.51 | (9%) | 0.41 | 0.52 | (21%) | ||||
| Copper Recovery (%) | 80.4% | 80.7% | (0%) | 78.9% | 81.7% | (3%) | ||||
| Gold Recovery (%) | 64.1% | 67.2% | (5%) | 63.5% | 67.4% | (6%) | ||||
| Mining costs - total ($/t mined material) | 1.65 | 2.03 | (19%) | 1.71 | 2.11 | (19%) | ||||
| Processing plant costs - total ($/t milled material) | 5.11 | 5.68 | (10%) | 5.21 | 7.00 | (25%) | ||||
| Concentrate Produced (dmt) | 52,643 | 48,171 | 9% | 138,972 | 117,829 | 18% | ||||
| Payable Gold Produced (oz) (2) | 49,854 | 55,355 | (10%) | 119,191 | 137,123 | (13%) | ||||
| Payable Copper Produced (000's lbs) (2) | 23,305 | 21,229 | 10% | 62,441 | 53,066 | 18% | ||||
| Gold Sales (payable oz)(2) | 44,817 | 55,935 | (20%) | 120,171 | 147,099 | (18%) | ||||
| Copper Sales (000's payable lbs)(2) | 21,726 | 21,907 | (1%) | 61,502 | 53,129 | 16% | ||||
| Average Realized Price - Gold - combined ($/oz )(1)(2) | 1,429 | 1,114 | 28% | 1,318 | 1,063 | 24% | ||||
| Average Realized Price - Copper - combined ($/lb) (1)(2) | 2.43 | 1.89 | 29% | 2.04 | 2.05 | (0%) | ||||
| Capital Expenditures - sustaining (1) | 8.8 | 7.1 | 23% | 21.2 | 26.7 | (21%) | ||||
| Unit Costs: | ||||||||||
| Production costs per ounce of gold sold | $ | 612 | $ | 648 | (6%) | $ | 755 | $ | 731 | 3% |
| Gold - All-in Sustaining costs on a by-product basis ($/oz sold) (1) | $ | 165 | $ | 557 | (70%) | $ | 562 | $ | 763 | (26%) |
| Gold - All-in Sustaining costs on a by-product basis - including taxes ($/oz sold) (1) | $ | 209 | $ | 583 | (64%) | $ | 596 | $ | 784 | (24%) |
| Gold - All-in Sustaining costs on a co-product basis ($/oz sold) (1) | $ | 770 | $ | 766 | 1% | $ | 905 | $ | 882 | 3% |
| Production costs per pound of copper sold | $ | 0.95 | $ | 1.16 | (18%) | $ | 1.15 | $ | 1.43 | (20%) |
| Copper - All-in Sustaining costs on a co-product basis ($/lb sold) (1) | $ | 1.18 | $ | 1.36 | (13%) | $ | 1.37 | $ | 1.72 | (20%) |
(1) Non-GAAP measure. See discussion under “Non-GAAP Measures”.
(2) Mount Milligan payable production and sales are presented on a 100% basis. Under the Mount Milligan Streaming Arrangement, Royal Gold is entitled to 35% of payable Gold ounces and 18.75% of payable copper. Royal Gold pays $435 per ounce of gold delivered and 15% of the spot price per metric tonne of copper delivered.
Third Quarter 2020 compared to Third Quarter 2019
Earnings from mine operations of $48.2 million were recognized in the third quarter of 2020 compared to $26.3 million in the third quarter of 2019. The increase was primarily due to lower production costs, and higher average realized gold and copper prices, partially offset by an increase in depreciation due to the revised mine life, and a decrease in ounces sold.
A chart accompanying this announcement is available at
https://www.globenewswire.com/NewsRoom/AttachmentNg/385ac886-f0f1-4558-b6f8-aa27ee77ef69
Cash provided by mine operations of $70.4 million was recognized in the third quarter of 2020 compared to $38.7 million in the third quarter of 2019. The increase was primarily due to lower production costs, higher average realized gold and copper prices and a decrease in working capital, partially offset by lower gold ounces sold. Free cash flow from mine operationsNG of $63.1 million was recognized in the third quarter of 2020 compared to $31.5 million in the third quarter of 2019, due to an increase in cash provided by mine operations.
During the third quarter of 2020, mining activities were in phases 4, 5 and 8 of the open pit. Total tonnes mined were 11.3 million tonnes and total material moved was 12.4 million tonnes in the third quarter of 2020. In the comparative quarter of 2019, total tonnes mined were 10.6 million tonnes and total material moved was 11.7 million tonnes.
Mining costs per tonne were $1.65 per tonne in the third quarter of 2020 compared to $2.03 per tonne in the third quarter of 2019. The decrease was due to a reduction in contract service costs associated with the in-pit drilling program, lower diesel fuel prices, lower labour cost, higher tonnage due to improved mining efficiencies and a favourable foreign exchange rate. This was partially offset by increased maintenance cost associated with major planned repairs of ancillary equipment.
Total mill throughput was 5.3 million tonnes, averaging 57,873 tonnes per calendar day in the third quarter of 2020 compared to 5.1 million tonnes, averaging 55,727 tonnes per calendar day in the third quarter of 2019. Higher throughput was a result of improved milling efficiencies and reduced time for the mill liner replacement.
Gold production was 49,854 ounces in the third quarter of 2020 compared to 55,355 ounces in the third quarter of 2019. The decrease was due to lower grades and recoveries, partially offset by higher throughput. During the third quarter of 2020, Mount Milligan’s average process plant head grade was 0.47 g/t compared to 0.51 g/t in the third quarter of 2019. Total copper production was 23.3 million pounds in the third quarter of 2020 compared to 21.2 million pounds in the third quarter of 2019. The increase was due to higher grades and higher throughput, partially offset by lower recoveries.
Processing costs per tonne were $5.11 per tonne in the third quarter of 2020 compared to $5.68 per tonne in the third quarter of 2019. The decrease was due to lower water sourcing costs, decreased electricity prices, decreased labour costs, higher tonnage due to improved efficiencies and a favourable foreign exchange rate. This was partially offset by higher maintenance costs associated with the mill relining that occurred during the third quarter of 2020.
Production costs per ounce of gold sold were $612 per ounce in the third quarter of 2020 compared to $648 in third quarter of 2019. The decrease was due to lower mining costs per tonne and lower processing costs per tonne.
Production costs per pound of copper sold were $0.95 per pound in the third quarter of 2020 compared to $1.16 in the third quarter of 2019. The decrease was primarily due to lower mining costs per tonne and lower processing costs per tonne.
A chart accompanying this announcement is available at
https://www.globenewswire.com/NewsRoom/AttachmentNg/791a1f4f-bd47-4874-9df5-1829986dcdfe
All-in sustaining costs on a by-product basis per ounce soldNG were $165 per ounce in the third quarter of 2020 compared to $557 per ounce in the third quarter of 2019. The decrease was primarily due to lower production costs as a result of decreased water sourcing and electricity costs and increased copper credits due to 29% higher realized copper prices, partially offset by higher sustaining capital and lower gold ounces sold.
All-in sustaining costs on a by-product basis per ounce sold including taxesNG were $209 per ounce in the third quarter of 2020 compared to $583 per ounce in the third quarter of 2019.
First Nine Months 2020 compared to First Nine Months 2019
Earnings from mine operations of $65.6 million were recognized in the first nine months of 2020 compared to $39.3 million in the first nine months of 2019. The increase was due to 24% higher average realized gold prices, 16% higher copper pounds sold and lower production costs. The increase was partially offset by higher depreciation and lower gold ounces sold.
A chart accompanying this announcement is available at
https://www.globenewswire.com/NewsRoom/AttachmentNg/e72c820f-a04e-4695-aad5-106014c0cfcb
Cash provided by mine operations of $141.3 million was recognized in the first nine months of 2020 compared to $76.6 million in the first nine months of 2019. The increase was due to greater earnings from mine operations and a reduction in working capital as a result of expedited collection of accounts receivable. Free cash flow from mine operationsNG of $119.5 million was recognized in the first nine months of 2020 compared to $49.9 million in the first nine months of 2019. The increase was due to an increase in cash provided by mine operations and a decrease in sustaining capital, due to the deferral of major rebuilds and infrastructure development projects.
During the first nine months of 2020, mining activities were in phases 3, 4 and 8 of the open pit. Total tonnes mined in the first nine months of 2020 were 30.3 million tonnes and total material moved was 33.2 million tonnes. In the comparative period of 2019, total tonnes mined were 29.9 million tonnes and total material moved was 32.3 million tonnes.
Mining costs per tonne were $1.71 per tonne in the first nine months of 2020 compared to $2.11 per tonne in the first nine months of 2019. The decrease was due to the deferral of certain mining fleet repairs, lower diesel price, lower contract service costs associated with the in-pit drilling program, lower labour costs, a favorable foreign exchange rate and higher tonnage due to improved efficiencies.
Total mill throughput was 14.6 million tonnes, averaging 53,169 tonnes per calendar day in the first nine months of 2020 compared to 12.4 million tonnes, averaging 45,535 tonnes per calendar day in the first nine months of 2019. The increase in throughput is primarily due to the increased availability of water, and continuous improvement to mill operations. In the first nine months of 2020, Mount Milligan recorded its highest level of concentrate tonnes produced since the start of operations in 2014.
Gold production was 119,191 ounces in the first nine months of 2020 compared to 137,123 ounces in the first nine months of 2019. The decrease was due to lower grades and recoveries, partially offset by higher throughput. During the first nine months of 2020, Mount Milligan’s average process plant gold head grade was 0.41 g/t with a recovery of 64% compared to 0.52g/t with a recovery of 67% in the first nine months of 2019. Total copper production was 62.4 million pounds in the first nine months of 2020 compared to 53.1 million pounds in the first nine months of 2019. The increase was primarily due to higher throughput, partially offset by lower copper recoveries.
Processing costs per tonne were $5.21 per tonne in the first nine months of 2020 compared to $7.00 per tonne in the first nine months of 2019. The decrease on a per tonne basis was due to higher throughput, decreased water sourcing costs, lower maintenance costs, lower labour costs, a favorable foreign exchange rate, and lower electricity costs. This was partially offset by higher mill consumables costs due to higher throughput and higher consulting costs associated with the mill relining.
Production costs per ounce of gold sold were $755 per ounce in the first nine months of 2020 compared to $731 per ounce in the same period of 2019. The increase was primarily due to lower gold sales.
Production costs per pound of copper sold were $1.15 per pound in the first nine months of 2020 compared to $1.43 per pound in the first nine months of 2019, primarily as a result of higher copper sales and lower production costs.
A chart accompanying this announcement is available at
https://www.globenewswire.com/NewsRoom/AttachmentNg/7b318560-d862-4471-b996-6a8ab4dc5c40
Mount Milligan’s all-in sustaining costs on a by-product basis per ounce soldNG, which excludes taxes, were $562 per ounce for the first nine months of 2020 compared to $763 per ounce in the same prior year period. The decrease was primarily due to lower production costs including lower water sourcing activities and lower electricity costs, increased copper credits and lower sustaining capital as a result of the deferral of major rebuilds and infrastructure development projects, offset by lower gold ounces sold.
All-in sustaining costs on a by-product basis per ounce sold including taxesNG were $596 per ounce in the first nine months of 2020 compared to $784 per ounce in the same period of 2019.
Öksüt Mine
The Öksüt Mine is situated in Turkey approximately 300 kilometres southeast of Ankara and 48 kilometres south of Kayseri, the provincial capital. The nearest administrative centre is at Develi, located approximately 10 kilometres north of the mine site.
The Öksüt Mine achieved first gold pour on January 31, 2020 and achieved commercial production on May 31, 2020. Commercial production was declared after the operation completed its testing phase and the constructed assets were operating in the manner intended by management. Up to the point of achieving commercial production, gold revenue and the associated costs of production were capitalized.
As at September 30, 2020, construction of the Öksüt Mine was substantially complete, with the remaining items being the completion of the heap leach pad phase 1C, a new overflow pond, and crusher modification, which are expected to be completed by the end of 2020. Phase 2 extension of the heap leach is expected to be completed by the end of 2021.
During the third quarter the Öksüt Mine obtained an amendment to its environmental impact assessment (EIA) certificate from the minister of environment and urbanization. The amendment is to accommodate changes to the Öksüt Mine’s open pit mine design and pit optimization. Because of the delay in receiving the amendment from the EIA and further expected delays in obtaining the related forestry permit, the Öksüt mine plan and design is currently being revised with the expectation that the high-grade ore of the Güneytepe deposit will not be accessed until late 2021.
COVID-19
During the third quarter of 2020, Öksüt’s operations continued normally, while maintaining active measures to prevent a COVID-19 outbreak at site.
Öksüt Mine
| ($ millions, except as noted) | Three months ended September 30, | Nine months ended September 30, | ||
| 2020 | 2020 | |||
| Financial Highlights: | ||||
| Revenue | $ | 97.6 | $ | 112.2 |
| Production costs | 18.1 | 21.4 | ||
| Depreciation, depletion and amortization | 8.3 | 8.9 | ||
| Earnings from mine operations | $ | 71.2 | $ | 81.9 |
| Cash provided by mine operations | 85.4 | 84.3 | ||
| Cash provided by mine operations before changes in working capital | 77.5 | 88.7 | ||
| Free cash flow from mine operations (1) | 74.1 | 58.7 | ||
| Operating Highlights: | ||||
| Tonnes mined (000's) | 4,351 | 10,674 | ||
| Tonnes ore mined (000's) | 1,396 | 2,463 | ||
| Ore mined - grade (g/t) | 2.23 | 1.67 | ||
| Ore crushed (000's) | 1,427 | 2,790 | ||
| Tonnes stacked (000's) | 1,315 | 2,494 | ||
| Heap leach grade (g/t) | 2.32 | 1.63 | ||
| Heap leach contained ounces stacked | 98,054 | 130,998 | ||
| Mining costs ($/t mined material) | 1.78 | 1.80 | ||
| Processing costs ($/t processed material) | 4.36 | 5.05 | ||
| Gold produced (ounces) | 51,412 | 66,689 | ||
| Gold sold (ounces)(2) | 51,120 | 66,123 | ||
| Average realized gold price ($/oz sold)(1) | 1,910 | 1,887 | ||
| Capital Expenditures - sustaining | - | - | ||
| Capital Expenditures - growth - cash | 6.7 | 24.2 | ||
| Capital Expenditures - stripping - cash (3) | 3.1 | 4.2 | ||
| Capital Expenditures - total | 9.8 | 28.4 | ||
| Unit Costs: | ||||
| Production costs per ounce of gold sold | $ | 354 | $ | 360 |
| Gold - All-in sustaining costs on a by-product basis ($/oz sold)(1)(3) | $ | 416 | $ | 433 |
| Gold - All-in sustaining costs on a by-product basis - including taxes ($/oz sold)(1)(3) | $ | 443 | $ | 457 |
(1) Non-GAAP measure. See discussion under “Non-GAAP Measures”.
(2) Includes 6,654 ounces sold before the mine was in commercial production.
(3) Calculated starting from June 1, 2020, after Öksüt achieved commercial production effective May 31, 2020.
Third Quarter 2020
Earnings from mine operations were $71.2 million in the third quarter of 2020. Cash provided by mine operations was $85.4 million and free cash flow from mine operationsNG was $74.1 million in the third quarter of 2020. During the third quarter of 2020, the Company spent $6.7 million on construction and development activities at Öksüt compared to $23.3 million in the third quarter of 2019.
Total ounces sold were 51,120 ounces in the third quarter of 2020 at an average realized price of $1,910 per ounce, resulting in revenue recognized of $97.6 million for the quarter.
Mining in the third quarter of 2020 was focused on the development of phase 2, phase 3 and phase 4 of the Keltepe pit, with total tonnes mined of 4.4 million tonnes, including 1.4 million tonnes of ore at an average gold grade of 2.23 g/t. Mining costs were $1.78 per tonne in the third quarter of 2020.
Processing in the third quarter of 2020 was focused on the preparation, stacking and irrigation of the heap leach pad. Processing costs, including crushing activities were $4.36 per tonne and gold production was 51,412 ounces of gold in the third quarter of 2020.
At the end of September 2020, 2.45 million tonnes of ore averaging 1.53 g/t gold had been placed onto the heap leach pad and was under leach with an estimated accumulated recovery to date of 72%, which includes estimated gold in process inventory.
Production costs per ounce of gold sold were $354 per ounce in the third quarter of 2020.
All-in sustaining costs on a by-product basis per ounce soldNG and all-in sustaining costs on a by-product basis per ounce sold including taxesNG were $416 per ounce and $443 per ounce, respectively, for the third quarter of 2020.
First Nine Months 2020
Earnings from mine operations were $81.9 million in the first nine months of 2020, representing earnings while in commercial production. Cash provided by mine operations was $84.3 million and free cash flow from mine operationsNG of $58.7 million was recognized in the first nine months of 2020, as capital costs associated with the project continued to be incurred. During the first nine months of 2020, the Company spent $24.2 million on construction and development activities at Öksüt compared to $57.7 million in the first nine months of 2019.
Total ounces sold in the first nine months of 2020 was 66,123 ounces including 59,469 ounces while in commercial production. The sale of gold was recorded as revenue starting on June 1, 2020, after Öksüt achieved commercial production effective May 31, 2020. Previously, revenue and costs of gold sales during the testing stage were capitalized against construction costs.
Total tonnes mined were 10.7 million tonnes in the first nine months of 2020 at a cost of $1.80 per tonne.
Processing costs were $5.05 per tonne and gold produced was 66,689 ounces in the first nine months of 2020, which included 57,031 ounces while in commercial production.
Production costs per ounce of gold sold were $360 per ounce in the first nine months of 2020.
All-in sustaining costs on a by-product basis per ounce soldNG and all-in sustaining costs on a by-product basis per ounce sold including taxesNG were $433 per ounce and 457 per ounce, respectively, for the first nine months of 2020 (post commercial production).
Molybdenum Business
The molybdenum business includes two North American primary molybdenum mines that are currently on care and maintenance: the Thompson Creek Mine (mine and process plant) in Idaho and the 75%-owned Endako Mine (mine, process plant and roaster) in British Columbia. The molybdenum business also includes the Langeloth metallurgical roasting facility (the "Langeloth Facility") in Pennsylvania. The Thompson Creek Mine (the “TC Mine”) operates a molybdenum beneficiation circuit to treat molybdenum concentrates to supplement the concentrate feed sourced directly for the Langeloth Facility. This beneficiation process allows the Company to process high copper content molybdenum concentrate purchased from third parties, which is then transported from TC Mine to the Langeloth Facility for further processing.
The molybdenum business provides tolling treatment services for customers by converting molybdenum concentrates to molybdenum oxide powder, briquettes and ferromolybdenum products. Additionally, molybdenum concentrates are purchased to convert to upgraded products which are then sold in the metallurgical and chemical markets.
COVID-19
The molybdenum business instituted a physical distancing policy for employees in confined and common areas, as well as a face mask policy for all areas where physical distancing of at least six feet cannot be achieved. Additional changes include general manager approval of all visitors, restricted site travel policies and promoting working remotely whenever possible. At the end of the quarter the molybdenum business remained COVID-19 free.
| ($ millions, except as noted) | Three months ended September 30, | Nine months ended September 30, | ||||||||
| Financial Highlights: | 2020 | 2019 | % Change | 2020 | 2019 | % Change | ||||
| Molybdenum (Mo) Sales | 31.6 | 48.7 | (35%) | 98.6 | 164.0 | (40%) | ||||
| Tolling, Calcining and Other | 0.8 | 1.5 | (45%) | 3.7 | 6.6 | (44%) | ||||
| Revenue | $ | 32.5 | $ | 50.2 | (35%) | $ | 102.3 | $ | 170.6 | (40%) |
| Production costs | 33.4 | 46.5 | (28%) | 116.9 | 164.5 | (29%) | ||||
| Depreciation, depletion and amortization | 1.7 | 0.9 | 97% | 5.1 | 3.3 | 55% | ||||
| Earnings (loss) from mine operations | (2.6) | 2.8 | (193%) | (19.7) | 2.8 | (792%) | ||||
| Reclamation expense | - | - | 0% | 43.5 | - | 0% | ||||
| Care and Maintenance costs - Molybdenum mines | 3.3 | 2.7 | 21% | 9.8 | 10.3 | (5%) | ||||
| Net loss from operations | $ | (7.1) | $ | (0.5) | 1465% | $ | (75.4) | $ | (9.4) | 704% |
| Total capital expenditure | 1.3 | 3.5 | (63%) | 3.5 | 4.3 | (19%) | ||||
| Cash provided by operations | 7.2 | 2.1 | (243%) | 15.2 | 1.7 | 794% | ||||
| Free cash flow (deficit) (1) | 5.9 | (0.8) | 838% | 11.7 | (2.0) | 685% | ||||
| Average Mo spot price ($/lb) | 7.71 | 11.83 | (35%) | 8.57 | 11.93 | (28%) | ||||
| Production Highlights (000's lbs): | ||||||||||
| Mo purchased | 3,453 | 4,347 | (21%) | 10,653 | 13,056 | (18%) | ||||
| Mo roasted | 3,059 | 3,990 | (23%) | 11,048 | 14,149 | (22%) | ||||
| Mo sold | 3,599 | 3,641 | (1%) | 10,056 | 12,458 | (19%) | ||||
| Toll roasted and upgraded Mo | 36 | 1,089 | (97%) | 1,997 | 4,287 | (53%) | ||||
(1) Non-GAAP measure. See discussion under “Non-GAAP Measures”.
Third Quarter 2020 compared to Third Quarter 2019
Loss from operations of $7.1 million were recognized in the third quarter of 2020 compared to a loss of $0.5 million in the third quarter of 2019. The increase was due to the decline in demand for molybdenum products and lower prices.
Cash generated by operations of $7.2 million was recognized in the third quarter of 2020, compared to $2.1 million in the third quarter of 2019. The cash generated was due to a $11.4 million United States tax refund received in the current period as a result of a change in the income tax laws in the U.S affecting prior year tax filings. Free cash flowNG of $5.9 million was recognized in the third quarter of 2020 compared to a free cash flow deficitNG of $0.8 million in the third quarter of 2019, due to the United States tax refund.
Molybdenum roasted was 3.1 million pounds in the third quarter of 2020 compared to 4 million pounds in the third quarter of 2019. The decrease was the result of the decline in demand for industrial products that use molybdenum, including steel, oil refining and aerospace industries, all of which were adversely affected by the demand disruption created by the COVID-19 pandemic.
A chart accompanying this announcement is available at
https://www.globenewswire.com/NewsRoom/AttachmentNg/3d165fe2-55e1-402a-ba90-576ca18eb264
First Nine Months 2020 compared to First Nine Months 2019
Loss from operations of $75.4 million was recognized in the first nine months of 2020 compared to a loss of $9.4 million in the first nine months of 2019. The loss recorded in the first nine months of 2020 included a $43.5 million charge for an increase in the asset retirement obligation, as a result of a decrease in the risk-free interest rate used for discounting the liability. The loss recorded in the first nine months of 2020 also included a $13.6 million write down in product inventory as a result of the decline in the molybdenum price in the first six months of 2020.
Cash provided by operations was $15.2 million in the first nine months of 2020 compared to cash provided by operations of $1.7 million in the first nine months of 2019. The increase was due to a $22.8 million United States tax refund received in the current year as a result of a change in income tax laws affecting prior year tax filings.
In the first nine months of 2020, 11 million pounds of molybdenum were roasted, including 2 million pounds from tolling arrangements, which represented a 23% and 115% decrease over the same prior year periods, respectively. The decrease was primarily due to the decline in demand for industrial products that use molybdenum which was adversely affected by the demand disruption created by the COVID-19 pandemic.
Pre-Development Projects
Kemess Underground Project:
The Kemess Project is located in north-central British Columbia, Canada, approximately 250 kilometres north of Smithers, 430 kilometres northwest of Prince George and 209 kilometres from the Mount Milligan Mine. The Kemess Project site (or “Kemess”) includes infrastructure from the past producing Kemess South Mine. There are currently no mining activities at the Kemess site and on-site activities consist of care and maintenance work, initial surface construction, and pre-development activities for the proposed Kemess Underground Project.
COVID-19
The Kemess Project continues to be free from any COVID-19 cases and is following all required health directives including pre-screening of all personnel travelling to site, enhanced hygiene and social distancing, minimizing non-essential site visitors and having personnel working remotely where practical.
Third Quarter 2020 compared to Third Quarter 2019
Care and maintenance of $4.5 million was recognized in the third quarter of 2020, compared to $3.1 million recognized in the third quarter of 2019. Capital expenditures of $5.9 million were recognized in the third quarter of 2020, compared to $11.4 million in the third quarter of 2019. The capital expenditures in the third quarter of 2020 included costs for technical engineering studies, water treatment plant performance testing and completion of the southern collection system pond construction. The capital expenditures in third quarter of 2019, included the construction of the water treatment plant, commissioning of the selenium treatment plant and the start of the southern collection system pond construction.
First Nine Months 2020 compared to First Nine Months 2019
Care and maintenance of $11.9 million was recognized in the first nine months of 2020, compared to $9.8 million recognized in the first nine months of 2019. Capital expenditures of $10.7 million were recognized in the first nine months of 2020, compared to $25.6 million in the first nine months of 2019. The capital expenditures in the first nine months of 2020 included costs for technical engineering studies, water treatment plant performance testing and completion of the southern collection system pond construction. The capital expenditures in the first nine months of 2019, included expenditures for the water treatment plant construction, water discharge system and the start of the southern collection system pond construction.
Greenstone Gold Property:
The Greenstone Gold property is located in northern Ontario, Canada approximately 275 kilometres northeast of Thunder Bay, Ontario. Centerra owns a 50% partnership interest in the Greenstone Partnership, which owns the Greenstone Gold development property, including the Hardrock deposit.
Refer to “Contingencies” for details of the statement of claim filed by the Company.
During the third quarter of 2020, Greenstone received the Industrial Sewage Works Environmental Compliance Approval. No construction decision has been made by the Greenstone Partnership.
As at September 30, 2020, Centerra’s contribution towards its C$185 million commitment in the Greenstone Partnership was C$170.1 million (US$129.3 million).
COVID-19
During the third quarter, the Geraldton site for environmental field work and exploration activities re-opened. The Oakville Office is re-opening gradually and on a voluntary basis.
Third Quarter 2020 compared to Third Quarter 2019
During the third quarter of 2020, the Company spent $5.3 million compared to $9.7 million in the comparative prior year period. Activities in the third quarter of 2020 included advancing detailed engineering, spending on vendor data, permitting, environmental and management plans, water modelling, implementation of indigenous community agreements, and exploration activities outside of the Hardrock deposit.
First Nine Months 2020 compared to First Nine Months 2019
During the first nine months of 2020, the Company spent $13.8 million compared to $24.5 million in the comparative prior year period. Activities in the first nine months of 2020 included advancing detailed engineering, spending on vendor data, permitting, environmental and management plans, fieldwork, water modelling, implementation of indigenous community agreements, and exploration activities including drilling and geophysics program outside of the Hardrock deposit.
Quarterly Results – Previous Eight Quarters
Over the last eight quarters, Centerra’s results reflect the impact of increasing gold sales during a period of rising gold prices. Production costs have also benefited from decreasing diesel fuel costs and depreciating Canadian, Kyrgyz and Turkish currencies over the last eight quarters. Gold sold on a quarterly basis steadily increased from the fourth quarter of 2018 to the third quarter of 2019, followed by a slight decline in the fourth quarter of 2019 and increasing again in the first nine months of 2020 as the Öksüt Mine reached commercial production. The Company recognized a non-cash increase in ARO expenses of $41.8 million in the fourth quarter of 2018 mainly to record an increase in water treatment costs at the TC Mine. The third quarter of 2019 reflects the impairment of $230.5 million recorded on the Mount Milligan Mine and the $10 million Kyrgyz Republic settlement expense. The fourth quarter of 2019 and first nine months of 2020 include a non-cash reclamation expense of $31.4 million and $43.5 million, respectively, as a result of a change in the interest rate used to discount the reclamation costs at the two mine sites which are not in operation. The quarterly financial results for the last eight quarters are shown below:
| $ million, except per share data | ||||||||
| Quarterly data unaudited | 2020 | 2019 | 2018 | |||||
| Q3 | Q2 | Q1 | Q4 | Q3 | Q2 | Q1 | Q4 | |
| Revenue | 515 | 413 | 374 | 313 | 388 | 341 | 334 | 392 |
| Net earnings (loss) | 206 | 88 | 20 | (12) | (165) | 33 | 50 | 49 |
| Basic earnings (loss) per share | 0.70 | 0.30 | 0.07 | (0.04) | (0.56) | 0.11 | 0.17 | 0.17 |
| Diluted earnings (loss) per share | 0.68 | 0.29 | 0.06 | (0.04) | (0.56) | 0.11 | 0.17 | 0.17 |
Contingencies
The following is a summary of contingencies with respect to matters affecting the Company and its subsidiaries. Readers are cautioned that the following is only a brief summary of such matters. For a more complete discussion of these matters, see the Company’s news releases and its Annual Information Form for the year ended December 31, 2019 and specifically the section therein entitled “Risks that can affect our business” available on SEDAR at www.sedar.com. The following summary also contains forward-looking statements and readers are referred to “Caution Regarding Forward-looking Information”.
Kyrgyz Republic
Kumtor Mine
Lysii Waste Rock Dump Movement
On December 1, 2019, Centerra announced that the Kumtor Mine experienced a significant waste rock movement at the Lysii waste rock dump, which resulted in the fatalities of two Kumtor employees. The Company and Kyrgyz state authorities have completed their investigations into the accident. Kyrgyz state authorities’ final reports concluded that there were no violations of Kyrgyz laws in connection with the accident. A criminal investigation, which is required in the Kyrgyz Republic any time there is a fatality at a workplace, was completed in the third quarter of 2020 and determined that no crime had occurred.
Petrov Lake Accident
On February 18, 2020, the Company announced that a fatal accident occurred at the Kumtor Mine when an excavator slipped down into a water filled basin while operating a shovel near Petrov Lake. The Company and Kyrgyz state authorities have completed their investigations into the accident. A criminal investigation into the accident was completed in the third quarter of 2020 and determined that no crime had occurred.
Canada
Mount Milligan Mine
As previously disclosed, in the first quarter of 2020, the Company received a notice of civil claim from H.R.S. Resources Corp. (“H.R.S.”), the holder of a 2% production royalty at Mount Milligan. H.R.S. claims that since November 2016 (when the royalty became payable) the Company has incorrectly calculated amounts payable under the production royalty agreement and has therefore underpaid amounts owing to H.R.S. The Company disputes the claim and believes it has calculated the royalty payments in accordance with the agreement. The Company believes that the potential exposure in relation to this claim, over what the Company has accrued, is not material.
Greenstone Gold Property
As previously disclosed, on December 23, 2019, the Company’s wholly owned subsidiary, AuRico Canadian Royalty Holdings Inc. (“AuRico”), filed with the Ontario Superior Court of Justice a statement of claim against Greenstone Gold Mines G.P. Inc. (the “Greenstone Managing Partner”), Premier Gold Mines Hardrock Inc., a subsidiary of Premier Gold Mines Limited (“Premier”) and two individual directors appointed by Premier to the Greenstone Managing Partner’s board of directors. The claim relates to, among other things, whether a report prepared by G-Mining Services Inc. on behalf of the Greenstone Managing Partner constitutes a “Feasibility Study” under the amended and restated partnership agreement that governs the partnership between affiliates of the Company and Premier and how the Greenstone Managing Partner and Premier responded to questions regarding the report that were raised by members of Greenstone Managing Partner’s board of directors, AuRico and the independent third-party expert retained by Centerra to review it. Statements of defense and/or counterclaim have been filed by Premier, two individuals nominated by Premier to the Greenstone Managing Partner’s board of directors and the Greenstone Managing Partner.
Other
The Company operates in multiple countries around the world and accordingly is subject to, and pays, taxes under the various regimes in those jurisdictions in which it operates. These tax regimes are determined under general taxation and other laws of the respective jurisdiction. The Company has historically filed, and continues to file, all required tax returns and to pay the taxes reasonably determined to be due. The tax rules and regulations in many countries are complex and subject to interpretation. From time to time the Company’s tax filings are subject to review and in connection with such reviews, disputes can arise with the taxing authorities over the Company’s interpretation of the country’s tax laws. The Company records provisions for future disbursements considered probable. As at September 30, 2020, the Company did not have any material provision for claims or taxation assessments.
Accounting Estimates, Policies and Changes
Accounting Estimates
The preparation of the Company’s consolidated financial statements in accordance with IFRS required management to make estimates and judgments that affect the amounts reported in the consolidated financial statements and accompanying notes. The critical estimates and judgments applied in the preparation of the Company’s condensed consolidated interim financial statements for the three and nine months ended September 30, 2020 are consistent with those used in the Company’s consolidated financial statements for the year ended December 31, 2019.
Management’s estimates and underlying assumptions are reviewed on an ongoing basis. Any changes or revisions to estimates and underlying assumptions are recognized in the period in which the estimates are revised and in any future periods affected. Changes to these critical accounting estimates could have a material impact on the consolidated financial statements.
The key sources of estimation uncertainty and judgment used in the preparation of the consolidated financial statements that have a significant risk of causing a material adjustment to the carrying amounts of assets and liabilities and earnings within the next financial year are outlined in detail in note 4 of the Company’s December 31, 2019 financial statements.
Disclosure Controls and Procedures and Internal Control Over Financial Reporting
The Company’s management, including the CEO and CFO, is responsible for the design of disclosure controls and procedures (“DC&P”) and internal controls over financial reporting (“ICFR”). Centerra adheres to the Committee of Sponsoring Organizations of the Treadway Commission’s (“COSO”) revised 2013 Internal Control Framework for the design of its ICFR. There was no material change to the Company’s internal controls over financial reporting that occurred during the third quarter of 2020 that has materially affected, or is reasonably likely to materially affect, the Company’s internal controls over financial reporting.
The evaluation of DC&P and ICFR was carried out under the supervision of and with the participation of management, including Centerra’s CEO and CFO. Based on these evaluations, the CEO and the CFO concluded that the design and operation of these DC&P and ICFR were effective throughout the third quarter of 2020.
Non-GAAP Measures
This document contains the following non-GAAP financial measures: all-in sustaining costs per ounce sold on a by-product basis, all-in sustaining costs per ounce sold on a by-product basis including taxes, and all-in sustaining costs per ounce sold on a co-product basis. In addition, non-GAAP financial measures include adjusted net earnings, adjusted net earnings per common share (basic and diluted), average realized gold price, average realized copper price, adjusted cash provided by operations, free cash flow and adjusted free cash flow. These financial measures do not have any standardized meaning prescribed by GAAP and are therefore unlikely to be comparable to similar measures presented by other issuers, even as compared to other issuers who may be applying the World Gold Council (“WGC”) guidelines, which can be found at http://www.gold.org.
Management believes that the use of these non-GAAP measures will assist analysts, investors and other stakeholders of the Company in understanding the costs associated with producing gold, understanding the economics of gold mining, assessing our operating performance, our ability to generate free cash flow from current operations and to generate free cash flow on an overall Company basis, and for planning and forecasting of future periods. However, the measures do have limitations as analytical tools as they may be influenced by the point in the life cycle of a specific mine and the level of additional exploration or expenditures a company has to make to fully develop its properties. Accordingly, these non-GAAP measures should not be considered in isolation, or as a substitute for, analysis of our results as reported under GAAP.
Definitions
The following is a description of the non-GAAP measures used in this MD&A:
- All-in sustaining costs on a by-product basis per ounce sold include production costs, the cash component of capitalized stripping costs, corporate general and administrative expenses, accretion expenses, and sustaining capital, net of copper and silver credits. The measure incorporates costs related to sustaining production. Copper and silver credits represent the expected revenue from the sale of these metals.
- All-in sustaining costs on a by-product basis per ounce sold including taxes, include revenue-based tax at Kumtor and taxes (mining and income) at Mount Milligan and Öksüt.
- All-in sustaining costs on a co-product basis per ounce of gold sold or per pound of copper sold, production costs are allocated between copper and gold based on production. To calculate the allocation of production costs, copper production has been converted to ounces of gold equivalent using the copper production for the periods presented, as well as an average of the futures prices during the quotational pricing period for copper and gold sold from Mount Milligan. For the third quarter and first nine months of 2020, 646 and 656 pounds of copper, respectively, were equivalent to one ounce of gold.
- Adjusted net earnings is calculated by adjusting net earnings (loss) as recorded in the condensed consolidated interim statements of income (loss) and comprehensive income (loss) for items not associated with ongoing operations.
- Adjusted cash provided by operations is calculated by adjusting cash provided by operations as recorded in the condensed consolidated interim statements of statements of cash flows for items not associated with ongoing operations.
- Average realized gold price is calculated by dividing the different components of gold sales (including third party sales, mark to market adjustments, final pricing adjustments and the fixed amount received under the Mount Milligan Streaming Arrangement) by the number of ounces sold.
- Average realized copper price is calculated by dividing the different components of copper sales (including third party sales, mark to market adjustments, final pricing adjustments and the fixed amount received under the Mount Milligan Streaming Arrangement) by the number of pounds sold.
- Free cash flow is calculated as cash provided by operations less additions to property, plant and equipment.
- Free cash flow from mine operations is calculated as cash provided by mine operations less additions to property, plant and equipment.
- Adjusted free cash flow is calculated as free cash flow adjusted for items not associated with ongoing operations.
Certain unit costs, including all-in sustaining costs on a by-product basis (including and excluding taxes) per ounce are non-GAAP measures and can be reconciled as follows:
| Three months ended September 30, | Nine months ended September 30, | |||||||||||||||||||||||||||||
| (Unaudited - $ millions, unless otherwise specified) | Consolidated (1) | Kumtor(1) | Mount Milligan(1) | Öksüt(1)(2) | Consolidated (1) | Kumtor(1) | Mount Milligan(1) | Öksüt(1)(2) | ||||||||||||||||||||||
| 2020 | 2019 | 2020 | 2019 | 2020 | 2019 | 2020 | 2019 | 2020 | 2019 | 2020 | 2019 | 2020 | 2019 | 2020 | 2019 | |||||||||||||||
| Production costs attributable to gold | 91.8 | 100.9 | 46.3 | 64.7 | 27.4 | 36.2 | 18.1 | - | 264.7 | 286.5 | 152.5 | 179.0 | 90.8 | 107.5 | 21.4 | - | ||||||||||||||
| Production costs attributable to copper | 20.6 | 25.3 | - | - | 20.6 | 25.3 | - | - | 70.8 | 76.1 | - | - | 70.8 | 76.1 | - | - | ||||||||||||||
| Total Production costs excluding molybdenum segment, as reported | 112.4 | 126.2 | 46.3 | 64.7 | 48.0 | 61.5 | 18.1 | - | 335.5 | 362.6 | 152.5 | 179.0 | 161.6 | 183.6 | 21.4 | - | ||||||||||||||
| Adjust for: | ||||||||||||||||||||||||||||||
| Selling and marketing | 1.8 | 2.0 | - | - | 1.8 | 2.0 | - | - | 5.8 | 5.7 | - | - | 5.8 | 5.7 | - | - | ||||||||||||||
| Refining fees | 1.8 | 1.7 | 1.6 | 1.4 | 0.2 | 0.3 | - | - | 5.7 | 4.5 | 5.1 | 3.8 | 0.6 | 0.7 | - | - | ||||||||||||||
| By-product credits - copper | (52.8) | (41.4) | - | - | (52.8) | (41.4) | - | - | (125.6) | (108.9) | - | - | (125.6) | (108.9) | - | - | ||||||||||||||
| Community costs related to current operations | 3.4 | 4.3 | 3.4 | 4.3 | - | - | - | - | 17.0 | 6.3 | 17.0 | 6.3 | - | - | - | - | ||||||||||||||
| Adjusted Production Costs | 66.6 | 92.8 | 51.3 | 70.4 | (2.8) | 22.4 | 18.1 | - | 238.4 | 270.2 | 174.6 | 189.1 | 42.4 | 81.1 | 21.4 | - | ||||||||||||||
| Corporate general administrative and other costs | 6.7 | 12.5 | - | - | 0.3 | - | - | - | 28.6 | 35.6 | - | - | 0.8 | - | - | - | ||||||||||||||
| Accretion expense | 0.3 | 0.6 | 0.3 | 0.4 | - | 0.2 | - | - | 0.8 | 1.5 | 0.8 | 1.1 | - | 0.4 | - | - | ||||||||||||||
| Capitalized stripping | 32.5 | 18.9 | 29.4 | 18.9 | - | - | 3.1 | - | 98.6 | 48.3 | 94.4 | 48.3 | - | - | 4.2 | - | ||||||||||||||
| Capital expenditures (sustaining) | 18.5 | 17.6 | 9.7 | 10.5 | 8.8 | 7.1 | - | - | 63.9 | 57.5 | 42.7 | 30.8 | 21.2 | 26.7 | - | - | ||||||||||||||
| Lease principal payments | 1.1 | 1.5 | - | - | 1.1 | 1.5 | - | - | 3.2 | 4.0 | - | - | 3.1 | 4.0 | 0.1 | - | ||||||||||||||
| All-in Sustaining Costs on a by-product basis | 125.6 | 144.0 | 90.7 | 100.2 | 7.4 | 31.2 | 21.2 | - | 433.5 | 417.1 | 312.5 | 269.3 | 67.5 | 112.2 | 25.7 | - | ||||||||||||||
| Revenue-based taxes | 37.9 | 33.0 | 37.9 | 33.0 | - | - | - | - | 113.3 | 88.2 | 113.3 | 88.2 | - | - | - | - | ||||||||||||||
| Income and mining taxes | 3.4 | 1.4 | - | - | 2.0 | 1.4 | 1.4 | - | 5.5 | 3.1 | - | - | 4.1 | 3.1 | 1.4 | - | ||||||||||||||
| All-in Sustaining Costs on a by-product basis (including taxes) | 166.9 | 178.4 | 128.6 | 133.2 | 9.4 | 32.6 | 22.6 | - | 552.3 | 508.4 | 425.8 | 357.5 | 71.6 | 115.3 | 27.1 | - | ||||||||||||||
| Ounces sold (000's) | 238.0 | 216.0 | 142.1 | 160.1 | 44.8 | 55.9 | 51.1 | - | 652.2 | 610.8 | 472.6 | 463.7 | 120.2 | 147.1 | 59.4 | - | ||||||||||||||
| Pounds sold (millions) | 21.7 | 21.9 | - | - | 21.7 | 21.9 | - | - | ||||||||||||||||||||||
| Production costs per ounce of gold sold ($ /oz sold) | 386 | 467 | 326 | 404 | 612 | 648 | 354 | - | 406 | 469 | 323 | 386 | 755 | 731 | 360 | - | ||||||||||||||
| Production costs per pound of copper sold ($ /pound sold) | 0.95 | 1.16 | n/a | n/a | 0.95 | 1.16 | n/a | n/a | 1.15 | 1.43 | n/a | n/a | 1.15 | 1.43 | n/a | n/a | ||||||||||||||
| Gold - All-in Sustaining Costs on a by-product basis ($ /oz sold) | 528 | 666 | 639 | 626 | 165 | 557 | 416 | - | 665 | 683 | 661 | 581 | 562 | 763 | 433 | - | ||||||||||||||
| Gold - All-in Sustaining Costs on a by-product basis (including taxes) - $ /oz sold | 701 | 825 | 905 | 832 | 209 | 583 | 443 | - | 847 | 832 | 901 | 771 | 596 | 784 | 457 | - | ||||||||||||||
| Gold - All-in Sustaining Costs on a co-product basis - before taxes ($ /oz sold) | 642 | 717 | 639 | 626 | 770 | 766 | 416 | - | 728 | 711 | 661 | 581 | 905 | 882 | 433 | - | ||||||||||||||
| Copper - All-in Sustaining Costs on a co-product basis - before taxes ($ /pound sold) | 1.18 | 1.36 | n/a | n/a | 1.18 | 1.36 | n/a | n/a | 1.37 | 1.72 | n/a | n/a | 1.37 | 1.72 | n/a | - | ||||||||||||||
| (1) Results may not add due to rounding | ||||||||||||||||||||||||||||||
| (2) Reflects costs while in commercial production | ||||||||||||||||||||||||||||||
Adjusted net earnings can be reconciled as follows:
Adjusted net earnings is intended to provide investors with information about the Company’s continuing income generating capabilities. This measure adjusts for the earnings impact of items not associated with ongoing operations.
| Three months ended September 30, | Nine months ended September 30, | ||||||||
| ($ millions, except as noted) | 2020 | 2019 | 2020 | 2019 | |||||
| Net earnings | $ | 205.7 | $ | (165.1) | $ | 313.3 | $ | (81.3) | |
| Adjust for items not associated with ongoing operations: | |||||||||
| Kyrgyz Republic settlement | 10.0 | - | 10.0 | ||||||
| Asset Impairment - Mount Milligan | - | 230.5 | - | 230.5 | |||||
| ARO revaluation at sites on care and maintenance | - | - | 43.5 | ||||||
| Adjusted net earnings | $ | 205.7 | $ | 75.4 | $ | 356.8 | $ | 159.2 | |
| Net earnings per share - basic | $ | 0.70 | $ | (0.56) | $ | 1.06 | $ | (0.28) | |
| Net earnings per share - diluted | $ | 0.68 | $ | (0.56) | $ | 1.05 | $ | (0.28) | |
| Adjusted net earnings per share - basic | $ | 0.70 | $ | 0.26 | $ | 1.21 | $ | 0.54 | |
| Adjusted net earnings per share - diluted | $ | 0.68 | $ | 0.26 | $ | 1.20 | $ | 0.54 | |
Adjusted operating cashflow can be reconciled as follows:
| Three months ended September 30 | Nine months ended September 30 | ||||||||
| ($ millions, except as noted) | 2020 | 2019 | 2020 | 2019 | |||||
| Cash provided by operations | $ | 358.8 | $ | 31.9 | $ | 748.0 | $ | 241.6 | |
| Adjust for items not associated with ongoing operations: | |||||||||
| Kyrgyz Republic settlement | 5.0 | 62.6 | 5.0 | 62.6 | |||||
| Adjusted cash provided by operations | $ | 363.8 | $ | 94.5 | $ | 753.0 | $ | 304.2 | |
Free cash flow is calculated as follows:
| Three months ended September 30 | Nine months ended September 30 | ||||||||
| ($ millions, except as noted) | 2020 | 2019 | 2020 | 2019 | |||||
| Cash provided by operations (1) | $ | 358.8 | $ | 31.9 | $ | 748.0 | $ | 241.6 | |
| Adjust for: | |||||||||
| Additions to property, plant and equipment (1) | (77.8) | (84.4) | (221.1) | (206.5) | |||||
| Free cash flow (deficit) | $ | 281.0 | $ | (52.5) | $ | 526.9 | $ | 35.1 | |
| Adjust for: | |||||||||
| Kyrgyz Republic settlement | 5.0 | 62.6 | 5.0 | 62.6 | |||||
| Adjusted Free cash flow | $ | 286.0 | $ | 10.1 | $ | 531.9 | $ | 97.7 | |
(1) As presented in the Company’s Consolidated Statement of Cash Flows.
Average realized sales price for gold
The average realized gold price per ounce sold is calculated by dividing gold sales revenue, together with the final pricing adjustments and mark-to-market adjustments by the ounces sold, as shown in the table below:
| Average realized sales price for gold | Three months ended September 30, | Nine months ended September 30, | ||
| 2020 | 2019 | 2020 | 2019 | |
| Gold sales reconciliation ($ millions) | ||||
| Gold sales - Kumtor | 268.2 | 234.4 | 803.5 | 627.1 |
| Gold sales - Öksüt | 97.6 | - | 112.2 | - |
| Gold sales - Mt. Milligan | ||||
| Gold sales related to cash portion of Royal Gold stream | 7.0 | 8.5 | 18.4 | 22.2 |
| Mark-to-market adjustments on sales to Royal Gold | 5.3 | 2.6 | 6.2 | 1.2 |
| Final adjustments on sales to Royal Gold | (5.0) | (3.0) | (10.3) | (3.1) |
| Total gold sales under Royal Gold stream | 7.3 | 8.1 | 14.3 | 20.3 |
| Gold sales to third party customers | 57.8 | 54.1 | 133.8 | 131.5 |
| Mark-to-market adjustments | (3.4) | (9.9) | 1.6 | (5.4) |
| Final pricing adjustments | 5.1 | 10.0 | 10.9 | 10.1 |
| Final metal adjustments | (2.5) | 0.4 | (1.7) | 0.4 |
| Total gold sales to third party customers | 57.0 | 54.6 | 144.6 | 136.6 |
| Gold sales, net of adjustments | 64.3 | 62.7 | 158.9 | 156.9 |
| Refining and treatment costs | (0.2) | (0.4) | (0.6) | (0.6) |
| Total gold sales | 64.1 | 62.3 | 158.3 | 156.3 |
| Total gold revenue - Consolidated | 429.9 | 296.7 | 1,074.0 | 783.4 |
| Ounces of gold sold | ||||
| Gold ounces sold - Kumtor | 142,132 | 160,088 | 472,572 | 463,663 |
| Gold ounces sold - Öksüt | 51,120 | - | 59,469 | - |
| Ounces sold to Royal Gold - Mt. Milligan | 15,623 | 19,541 | 41,842 | 51,223 |
| Ounces sold to third party customers - Mt. Milligan | 29,194 | 36,394 | 78,329 | 95,876 |
| Total ounces sold - Consolidated(1) | 238,069 | 216,023 | 652,212 | 610,761 |
| Average realized sales price for gold on a per ounce basis | ||||
| Average realized sales price - Kumtor | 1,887 | 1,464 | 1,700 | 1,352 |
| Average realized sales price - Öksüt | 1,910 | - | 1,887 | - |
| Average realized gold price - Royal Gold | 435 | 435 | 435 | 435 |
| Average realized gold price - Mark-to-market adjustments | 340 | 132 | 147 | 23 |
| Average realized gold price - Final pricing adjustments | (321) | (155) | (247) | (60) |
| Average realized gold price - Mt. Milligan - Royal Gold | 454 | 412 | 336 | 398 |
| Average realized gold price - Third party | 1,981 | 1,487 | 1,708 | 1,372 |
| Average realized gold price - Mark-to-market adjustments | (117) | (271) | 20 | (56) |
| Average realized gold price - Final pricing adjustments | 174 | 275 | 139 | 105 |
| Average realized gold price - Final metal adjustments | (87) | 10 | (22) | 4 |
| Average realized gold price - Mt. Milligan - Third party | 1,951 | 1,500 | 1,846 | 1,425 |
| Average realized gold price - Mt. Milligan - Combined | 1,429 | 1,114 | 1,318 | 1,063 |
| Average realized sales price for gold - Consolidated | 1,806 | 1,374 | 1,647 | 1,282 |
(1) Includes ounces sold at Öksüt from June 1, 2020, after Öksüt achieved commercial production on May 31, 2020.
Average realized sales price for Copper - Mount Milligan
The average realized copper price per pound is calculated by dividing copper sales revenue, together with the final pricing adjustments and mark-to-market adjustments per pound, as shown in the table below:
| Average realized sales price for Copper - Mount Milligan | Three months ended September 30, | Nine months ended September 30, | ||
| 2020 | 2019 | 2020 | 2019 | |
| Copper sales reconciliation ($ millions) | ||||
| Copper sales related to cash portion of Royal Gold stream | 1.9 | 1.6 | 4.5 | 4.1 |
| Mark-to-market adjustments on Royal Gold stream | 2.4 | (0.4) | 1.7 | (0.3) |
| Final adjustments on sales to Royal Gold | (2.5) | 0.7 | (2.2) | 0.1 |
| Total copper sales under Royal Gold stream | 1.8 | 1.9 | 4.0 | 3.9 |
| Copper sales to third party customers | 54.6 | 46.6 | 130.4 | 117.0 |
| Mark-to-market adjustments | (2.3) | 0.2 | 2.2 | 2.8 |
| Final pricing adjustments | 4.8 | (1.9) | 3.3 | (0.5) |
| Final metal adjustments | (1.7) | (0.1) | (2.6) | (1.0) |
| Total copper sales to third party customers | 55.4 | 44.8 | 133.3 | 118.3 |
| Copper sales, net of adjustments | 57.2 | 46.7 | 137.4 | 122.2 |
| Refining and treatment costs | (4.4) | (5.3) | (11.8) | (13.3) |
| Copper sales | 52.8 | 41.4 | 125.6 | 108.9 |
| Pounds of copper sold (000's lbs) | ||||
| Pounds sold to Royal Gold | 4,082 | 4,130 | 11,561 | 9,998 |
| Pounds sold to third party customers | 17,644 | 17,777 | 49,941 | 43,131 |
| Total pounds sold | 21,726 | 21,907 | 61,502 | 53,129 |
| Average realized sales price for copper on a per pound basis | ||||
| Copper sales related to cash portion of Royal Gold stream | 0.45 | 0.39 | 0.39 | 0.41 |
| Mark-to-market adjustments on Royal Gold stream | 0.58 | (0.09) | 0.15 | (0.03) |
| Final pricing adjustments on Royal Gold stream | (0.62) | 0.18 | (0.19) | 0.01 |
| Average realized copper price - Royal Gold | 0.44 | 0.48 | 0.35 | 0.39 |
| Average realized copper price - Third party | 3.10 | 2.61 | 2.61 | 2.69 |
| Average realized copper price - Mark-to-market adjustments | (0.13) | 0.01 | 0.04 | 0.07 |
| Average realized copper price - Final pricing adjustments | 0.27 | (0.11) | 0.07 | (0.01) |
| Average realized copper price - Metal pricing adjustments | (0.10) | (0.01) | (0.02) | (0.03) |
| Average realized copper price - Third party | 3.14 | 2.50 | 2.70 | 2.72 |
| Average realized copper price - Combined | 2.43 | 1.89 | 2.04 | 2.05 |
Qualified Person & QA/QC – Production, Mineral Reserves and Mineral Resources
All scientific and technical information in this document (other than exploration related information) has been approved by John Fitzgerald, Professional Engineer and Centerra’s Vice President, Projects and Technical Services, who is the qualified person for the purpose of NI 43-101.
| Centerra Gold Inc. | |||||||||
| Condensed Consolidated Interim Statements of Financial Position | |||||||||
| (Unaudited) | September 30, | December 31, | |||||||
| 2020 | 2019 | ||||||||
| (Expressed in thousands of United States Dollars) | |||||||||
| Assets | |||||||||
| Current assets | |||||||||
| Cash | $ | 484,187 | $ | 42,717 | |||||
| Amounts receivable | 46,980 | 79,022 | |||||||
| Inventories | 622,417 | 774,060 | |||||||
| Other current assets | 22,699 | 36,869 | |||||||
| 1,176,283 | 932,668 | ||||||||
| Property, plant and equipment | 1,734,051 | 1,669,516 | |||||||
| Reclamation deposits | 47,074 | 40,999 | |||||||
| Other assets | 34,347 | 58,470 | |||||||
| 1,815,472 | 1,768,985 | ||||||||
| Total assets | $ | 2,991,755 | $ | 2,701,653 | |||||
| Liabilities and Shareholders' equity | |||||||||
| Current liabilities | |||||||||
| Accounts payable and accrued liabilities | $ | 219,245 | $ | 238,339 | |||||
| Revenue-based taxes payable | 18,726 | 744 | |||||||
| Taxes payable | 4,365 | 1,034 | |||||||
| Other current liabilities | 10,585 | 4,692 | |||||||
| 252,921 | 244,809 | ||||||||
| Long-term debt | - | 70,007 | |||||||
| Deferred income tax liability | 33,724 | 33,733 | |||||||
| Provision for reclamation | 313,939 | 265,049 | |||||||
| Other liabilities | 20,763 | 22,211 | |||||||
| 368,426 | 391,000 | ||||||||
| Shareholders' equity | |||||||||
| Share capital | 974,350 | 960,404 | |||||||
| Contributed surplus | 29,853 | 26,278 | |||||||
| Accumulated other comprehensive loss | 1,546 | (752) | |||||||
| Retained earnings | 1,364,659 | 1,079,914 | |||||||
| 2,370,408 | 2,065,844 | ||||||||
| Total liabilities and Shareholders' equity | $ | 2,991,755 | $ | 2,701,653 | |||||
| Centerra Gold Inc. | ||||||||||
| Condensed Consolidated Interim Statements of Earnings and Comprehensive Income | ||||||||||
| (Unaudited) | Three months ended September 30, | Nine months ended September 30, | ||||||||
| 2020 | 2019 | 2020 | 2019 | |||||||
| (Expressed in thousands of United States Dollars) | ||||||||||
| (except per share amounts) | ||||||||||
| Revenue | $ | 515,166 | $ | 388,276 | $ | 1,301,864 | $ | 1,062,825 | ||
| Cost of sales | ||||||||||
| Production costs | 145,817 | 172,772 | 452,368 | 527,200 | ||||||
| Depreciation, depletion and amortization | 83,182 | 66,837 | 241,647 | 180,232 | ||||||
| Standby costs | - | - | 6,728 | - | ||||||
| Earnings from mine operations | 286,167 | 148,667 | 601,121 | 355,393 | ||||||
| Care and maintenance | 7,870 | 5,904 | 21,732 | 20,108 | ||||||
| Exploration and development costs | 14,315 | 12,647 | 32,770 | 31,359 | ||||||
| Corporate administration | 6,439 | 12,724 | 28,324 | 36,110 | ||||||
| Revenue-based taxes | 37,874 | 32,984 | 113,339 | 88,155 | ||||||
| Impairment | - | 230,500 | - | 230,500 | ||||||
| Other operating expenses | 8,225 | 17,704 | 71,924 | 24,853 | ||||||
| Earnings (loss) from operations | 211,444 | (163,796) | 333,032 | (75,692) | ||||||
| Other expenses (income), net | 117 | (1,133) | 5,447 | (1,871) | ||||||
| Finance costs | 2,036 | 3,428 | 9,454 | 11,077 | ||||||
| Earnings (loss) before income tax | 209,291 | (166,091) | 318,131 | (84,898) | ||||||
| Income tax expense (recovery) | 3,548 | (980) | 4,804 | (3,618) | ||||||
| Net earnings (loss) | 205,743 | (165,111) | 313,327 | (81,280) | ||||||
| Other Comprehensive Income | ||||||||||
| Items that may be subsequently reclassified to earnings: | ||||||||||
| Net (loss) gain on translation of foreign operations | (546) | (387) | (875) | 1,052 | ||||||
| Net unrealized gain (loss) on derivative instruments, net of tax | 2,804 | (407) | 3,173 | (432) | ||||||
| Other comprehensive income (loss) | 2,258 | (794) | 2,298 | 620 | ||||||
| Total comprehensive income (loss) | $ | 208,001 | $ | (165,905) | $ | 315,625 | $ | (80,660) | ||
| Basic earnings (loss) per share | $ | 0.70 | $ | (0.56) | $ | 1.06 | $ | (0.28) | ||
| Diluted earnings (loss) per share | $ | 0.68 | $ | (0.56) | $ | 1.05 | $ | (0.28) | ||
| Centerra Gold Inc. | ||||||||||
| Condensed Consolidated Interim Statements of Cash Flows | ||||||||||
| (Unaudited) | Three months ended September 30, | Nine months ended September 30, | ||||||||
| 2020 | 2019 | 2020 | 2019 | |||||||
| (Expressed in thousands of United States Dollars) | ||||||||||
| Operating activities | ||||||||||
| Net earnings (loss) | $ | 205,743 | $ | (165,111) | $ | 313,327 | $ | (81,280) | ||
| Adjustments for the following items: | ||||||||||
| Depreciation, depletion and amortization | 84,854 | 68,313 | 249,936 | 184,623 | ||||||
| Finance costs | 2,036 | 3,428 | 9,454 | 11,077 | ||||||
| Share-based compensation expense | 926 | 6,940 | 11,806 | 18,440 | ||||||
| Reclamation expense | 414 | - | 43,919 | 2,056 | ||||||
| Asset impairment | - | 230,500 | - | 230,500 | ||||||
| Inventory impairment | - | - | 13,588 | - | ||||||
| Kyrgyz Republic settlement payment | (5,000) | (62,600) | (5,000) | (62,600) | ||||||
| Additional provision of Kyrgyz Republic settlement | - | 10,000 | - | 10,000 | ||||||
| Income tax (recovery) expense, net | 3,548 | (980) | 4,804 | (3,618) | ||||||
| Income tax (paid) refunded | 10,798 | (1,964) | 20,647 | (381) | ||||||
| Other | 1,690 | 1,284 | 2,409 | (3,403) | ||||||
| Cash provided by operations before changes in working capital | $ | 305,009 | $ | 89,810 | $ | 664,890 | $ | 305,414 | ||
| Change in working capital | 53,824 | (57,956) | 83,159 | (63,810) | ||||||
| Cash provided by operations | $ | 358,833 | $ | 31,854 | $ | 748,049 | $ | 241,604 | ||
| Investing activities | ||||||||||
| Additions to property, plant and equipment | (77,796) | (84,433) | (221,059) | (206,535) | ||||||
| Proceeds from disposition of fixed assets | 29 | 450 | 337 | 450 | ||||||
| Proceeds from disposition of marketable securities | 2,902 | - | 2,902 | - | ||||||
| Decrease (increase) in restricted cash | 432 | (1,089) | 26,422 | (1,068) | ||||||
| Increase in other assets | (1,651) | (5,102) | (6,602) | (10,358) | ||||||
| Cash used in investing | $ | (76,084) | $ | (90,174) | $ | (198,000) | $ | (217,511) | ||
| Financing activities | ||||||||||
| Debt drawdown | - | 121,018 | 250,000 | 206,872 | ||||||
| Debt repayment | - | (120,000) | (327,472) | (296,000) | ||||||
| Payment of interest and borrowing costs | (1,008) | (2,140) | (5,862) | (7,398) | ||||||
| Dividends paid | (11,277) | - | (28,269) | - | ||||||
| Lease payments | (1,284) | (3,164) | (4,436) | (6,013) | ||||||
| Proceeds from common shares issued | 2,794 | 3,114 | 7,460 | 7,228 | ||||||
| Cash used in financing | $ | (10,775) | $ | (1,172) | $ | (108,579) | $ | (95,311) | ||
| Increase (decrease) in cash during the period | 271,974 | (59,492) | 441,470 | (71,218) | ||||||
| Cash at beginning of the period | 212,213 | 139,979 | 42,717 | 151,705 | ||||||
| Cash at end of the period | $ | 484,187 | $ | 80,487 | $ | 484,187 | $ | 80,487 | ||
The Unaudited Interim Consolidated Financial Statements and Notes for the three and nine months ended September 30, 2020 and Management’s Discussion and Analysis for the period ended September 30, 2020 have been filed on the System for Electronic Document Analysis and Retrieval (“SEDAR”) at www.sedar.com and are available at the Company’s web site at: www.centerragold.com.
Supplementary Information: Third Quarter 2020 Exploration Update
Exploration activities in the third quarter of 2020 included drilling, surface sampling, geological mapping and geophysical surveying at the Company’s various projects (including earn-in properties), targeting gold and copper mineralization in Canada, Turkey, Finland, USA and the Kyrgyz Republic. In the third quarter of 2020, the Company ceased exploration activities in Mexico. The Company has expanded its 2020 exploration program when compared to 2019 and is primarily focused on brownfield exploration at Kumtor, Mount Milligan and Öksüt. Exploration expenditures totalled $11.7 million in the third quarter of 2020, which reflect the impact of delays associated with COVID-19, compared to $7.6 million in the same quarter of 2019.
Kumtor Mine
The drilling program for 2020 includes 55,000 planned metres of exploration drilling, which is focused on priority and high potential targets. Primary targets include various zones of the Central, Southwest and Sarytor deposits where positive drilling results between 2018 and 2019 had been identified.
During the third quarter of 2020, exploration drilling programs continued with the completion of 45 diamond drill holes and 11 reverse circulation (RC) drill holes totalling 11,412 metres. Exploration drilling focused on testing zones of sulphide (Central Pit – Northeast wall) and oxide mineralization, at the corridor between the Central and Southwest pits (Hope, Triangle and Southwest Oxide Deep zones), on the periphery of the Sarytor and Northeast Deposits and Muzdusuu Zone (Central Deposit).
Central Deposit
In the third quarter of 2020, a total of five diamond drill holes were completed in the Central Deposit for a total of 1,334 metres.
In the Northeast Wall of the Central Pit, one exploration drill hole was completed in the quarter. A significant intersection is reported below:
| D2065 | 6.0 metres @ 1.39 g/t Gold (“Au”) from 572.8 metres |
Four drill holes have been completed in the Triangle Zone of the Central Pit. Recent drilling results indicate new potential oxide areas that require further exploration.
Results for most of the third quarter of 2020 drilling is pending and selected intercepts to date are highlighted below:
| D2072 | 4.6 metres @ 3.10 g/t Au from 394.1 metres |
Southwest Deposit
In the third quarter of 2020, a total of 30 diamond drill holes were completed in the Southwest area for a total of 6,655 metres.
Twelve drill holes have been completed in the Hope Zone between Southwest and Central Pits for a total of 2,504 metres. Results from recent drilling have delineated a lens-shaped oxide gold mineralization. This mineralization extends along the hanging wall of the Kumtor Lower Thrust for more than 400 metres. Maximum thickness of the oxide gold mineralization is around 20 metres.
Significant intersections are reported below:
| SW-20-325 | 7.6 metres @ 1.47 g/t Au from 243.5 metres |
| SW-20-329 | 18.7 metres @ 1.23 g/t Au from 103.5 metres including 6.0 metres @ 2.65 g/t Au from 109.5 metres 22.8 metres @ 0.54 g/t Au from 128.8 metres including 6.1 metres @ 1.11 g/t Au from 144.5 metres |
| SW-20-335 | 20.3 metres @ 2.90 g/t Au from 249.5 metres including 3.4 metres @ 12.04 g/t Au from 249.5 metres |
| SW-20-337 | 18.4 metres @ 3.92 g/t Au from 60.0 metres including 8.3 metres @ 7.65 g/t Au from 60.0 metres |
| SW-20-340 | 16.5 metres @ 4.12 g/t Au from 131.2 metres including 5.4 metres @ 9.06 g/t Au from 135.4 metres |
In the Southwest Oxide Deep Zone, 18 drill holes were completed for a total of 4,135 metres.
Selected best intercepts are listed below with some results still pending.
| SW-20-317 | 158.2 metres @ 2.95 g/t Au from 224.0 metres including 57.5 metres @ 5.90 g/t Au from 322.7 metres 11.1 metres @ 0.18 g/t Au from 424.1 metres |
| SW-20-332 | 5.5 metres @ 2.48 g/t Au from 22.0 metres |
| SW-20-332A | 5.3 metres @ 1.75 g/t Au from 22.2 metres |
| SW-20-334 | 5.0 metres @ 13.53 g/t Au from 196.5 metres |
Drill hole SW-20-317 (drilled in Q2) intersected an unusually wide interval of mineralized oxidized rocks. This hole was drilled towards the SE and the true width of the oxide gold mineralization may be less than the down hole intercept.
Muzdusuu Zone
Five diamond drill holes were completed in the Muzdusuu Zone for a total of 680 metres. Drilling in the Muzdusuu Zone (outside Central Pit) is designed to explore for oxide and mixed gold mineralization along the Kumtor Lower Thrust.
A significant interval is reported below:
| DM2070 | 15.3 metres @ 1.68 g/t Au from 162.5 metres including 5.0 metres @ 3.69 g/t Au from 167.5 metres |
Northeast Deposit
In the Northeast Deposit, 11 RC drill holes were completed for a total of 1,447 metres. Drilling was in the northwestern part of the area, where drill holes intersected low-grade oxide gold mineralization confined to a tectonic mélange zone. Assay results are not yet available.
Sarytor Deposit
In the third quarter of 2020, a total of five diamond drill holes were completed in the Sarytor Deposit for a total of 1,296 metres. Assay results are pending.
The above mineralized intercepts were calculated using a cut-off grade of 1.0 g/t Au for sulphide and 0.1 g/t Au for oxide mineralization, minimum interval of 4.0 metres and a maximum internal dilution interval of 5.0 metres. The true widths for sulphide and oxide mineralized intervals reported represent approximately 70 to 95% of the stated down hole interval. Drill collar locations and associated graphics are available at the following link:
A full listing of the drill results, drill hole locations and plan map (including the azimuth, dip of drill holes, and depth of the sample intervals) for the Kumtor Mine have been filed on the System for Electronic Document Analysis and Retrieval (“SEDAR”) at www.sedar.com and are available at the Company’s web site www.centerragold.com.
Mount Milligan Mine
The 2020 drilling program at Mount Milligan totals approximately 34,850 planned metres. To date 23,848 metres have been drilled in 71 drill holes. This includes 17,500 planned metres (approximately 38 drill holes) of in-pit exploration of which 6,501 metres were completed by the end of the third quarter; 12,171 metres (26 drill holes) of completed brownfield exploration drilling; and 5,176 planned metres of greenfield exploration of which 3,576 metres were completed in seven drill holes by the end of third quarter.
In-Pit drilling
In the third quarter, eight in-pit drill holes were completed totaling 3,928 metres. Of these, four drill holes (1,953 metres) tested the Great Eastern Fault (“GEF”) zone on the pit east wall, and four drill holes (1,975 metres) tested the DWBX zone on the pit northwest wall. Assay results were returned for three drill holes from the GEF zone during the quarter. Low grade porphyry gold-copper mineralization was intersected in each of these holes.
Significant intervals are reported below:
| 20-1239 | 32.9 metres @ 0.19 g/t Au, 0.22% Copper (“Cu”) from 275.1 metres including 1.9 metres @ 1.05 g/t Au, 0.92% Cu from 278.0 metres |
| 20-1241 | 4.1 metres @ 0.60 g/t Au 0.42% Cu from 46.3 metres. |
Significant intersections in the GEF zone are hosted in andesite volcaniclastic rocks crosscut by narrow hornblende monzonite units or are within the fault zone. Early stage alteration-mineralization (potassic and calc-potassic assemblages) is overprinted by later transitional stage alteration and veins (quartz-sericite-pyrite-carbonate; QSPC). Pyrite reaches up to 2% and chalcopyrite to 1.5%.
Brownfield drilling
In the third quarter, 20 brownfield exploration drill holes were completed totaling 9,683 metres. Assay results were returned for 10 drill holes during the quarter.
Significant intervals are reported below:
| 20-1246 | 26.0 metres @ 1.10 g/t Au, 0.06% Cu from 189.0 metres including 2.0 metres @ 2.88 g/t Au, 0.17% Cu from 189.0 metres and 10.6 metres @ 1.98 g/t Au, 0.05% Cu from 198.4 metres. 10.5 metres @ 3.55 g/t Au, 0.09% Cu from 335.5 metres including 4.4 metres @ 8.32 g/t Au, 0.19% Cu from 341.6 metres |
| 20-1249 | 22.5 metres @ 1.54 g/t Au, 0.02% Cu from 67.5 metres including 7.5 metres @ 4.17 g/t Au, 0.03% Cu from 69.5 metres 5.3 metres @ 7.19 g/t Au, 0.09% Cu from 266.7 metres including 1.4 metres @ 25.60 g/t Au, 0.13% Cu from 268.6 metres |
| 20-1251 | 6.3 metres @ 4.15 g/t Au, 0.08% Cu from 261.0 metres including 2.0 metres @ 12.90 g/t Au, 0.08% Cu from 261.0 metres |
| 20-1255 | 38.0 metres @ 0.54 g/t Au, 0.04% Cu from 139.0 metres including 2.0 metres @ 5.97 g/t Au, 0.15% Cu from 153.0 metres |
Significant intersections in the South Boundary zone are hosted in andesite volcaniclastic rocks crosscut by narrow monzonite units, breccias and faults. Intermediate to late stage alteration-mineralization (QSPC) and associated veins and vein stockwork overprint early stage assemblages (potassic and propylitic). Drilling was planned to intersect mineralized veins at a high angle, so reported widths approximate true widths. Pyrite reaches up to 12% and chalcopyrite to 1.5%.
The planned 2020 Phase-2 brownfield drilling program (3,000 metres in two drill holes) is scheduled to run from mid-October to late November and will target porphyry gold-copper mineralization associated with a geophysically inferred source pluton underlying the MBX and Saddle zones.
The above mineralized intercepts were calculated using a cut-off grade of 0.1 g/t Au and a maximum internal dilution interval of 4 metres. Significant assay intervals reported represent apparent widths due to the undefined and open geometry of mineralization in these zones, or conceptual nature of exploration targets. Drill collar locations and associated graphics are available at the following link:
A full listing of the drill results, drill hole locations and plan map (including the azimuth, dip of drill holes, and depth of the sample intervals) for the Mount Milligan Mine have been filed on the System for Electronic Document Analysis and Retrieval (“SEDAR”) at www.sedar.com and are available at the Company’s web site www.centerragold.com.
Öksüt Mine
During the third quarter, the 2020 drilling program continued with four drill rigs at Öksüt. In total, 38 exploration and infill drill holes were completed for 9,356 metres. In addition, eight geotechnical drill holes were completed totaling 1,464 metres. The exploration and infill drill holes mainly focused on expanding the gold resources at the Güneytepe deposit and to develop the Keltepe North oxide gold resource, which was discovered last year. Apart from Güneytepe oxide gold, sulphide gold and supergene copper mineralization potential beneath the current pit was also targeted.
Assay results have been received for the completed drill holes. The highlights are:
Güneytepe (testing resource expansion of oxide and sulphide gold)
| ODD0393 | 151.1 metres @ 0.51 g/t Au from 46.5 metres including 9.2 metres @ 1.2 g/t Au from 83 metres |
| ODD0398 | 74.0 metres @ 0.70 g/t Au from the bottom of the pit including 11 metres @ 1.41 g/t Au from 1 metre |
| ODD0399 | 153.9 metres @ 2.13 g/t Au from the bottom of the pit including 32.0 metres @ 7.14 g/t Au from 11 metres |
| ODD0405 | 59.5 metres @ 1.77 g/t Au from 2.5m Including 36.5 metres @ 2.63 g/t Au from 21.5 metres |
| ODD0407 | 141.7 metres @ 0.63 g/t Au from 29.0 metres including 17.5 metres @ 1.03 g/t Au from 3.5 metres |
Keltepe North (testing potential of oxide gold)
| ODD0411 | 8.1 metres @ 0.52 g/t Au from 20.4 metres |
| ODD0413 | 39.4 metres @ 0.39 g/t Au from 86.4 metres |
| ODD0416 | 26.8 metres @ 0.82 g/t Au from 37.7 metres |
| ODD0420 | 89.0 metres @ 0.61 g/t Au from 37 metres including 11.5 metres @ 2.09 g/t Au from 69 metres |
Following the return of significant gold intercepts from the sulphide zone at Güneytepe, preliminary metallurgical test work, involving bottle roll tests, and petrological analysis of selected samples was undertaken to better understand the characteristics of the sulphide mineralization. The bottle roll results indicated that gold recoveries may vary from 14% to 72% in the sulphide zone, with the recoveries being influenced by the copper content of the samples.
The above mineralized intercepts were calculated using a cut-off grade of 0.2 g/t Au and a maximum internal dilution interval of 5 metres. The true widths of the mineralized intervals reported represent approximately 60 to 90% of the stated downhole interval. Drill collar locations and associated graphics are available at the following link:
A full listing of the drill results, drill hole locations and plan map (including the azimuth, dip of drill holes, and depth of the sample intervals) for the Öksüt Gold Mine have been filed on the System for Electronic Document Analysis and Retrieval (“SEDAR”) at www.sedar.com and are available at the Company’s web site www.centerragold.com.
Qualified Person & QA/QC – Exploration
Exploration information and related scientific and technical information in this document regarding the Kumtor Mine were prepared in accordance with the standards of National Instrument 43-101 (“NI 43-101”) and were prepared, reviewed, verified and compiled by Boris Kotlyar, a member with the American Institute of Professional Geologists (AIPG), Chief Geologist, Global Exploration with Centerra, who is the qualified person for the purpose of NI 43-101. Sample preparation, analytical techniques, laboratories used, and quality assurance-quality control protocols used during the exploration drilling programs are done as described in the Kumtor Technical Report dated March 20, 2015 (with an effective date of December 31, 2014). The Kumtor deposit is described in the 2019 Annual Information Form and the Kumtor Technical Report, which are both filed on SEDAR at www.sedar.com.
Exploration information and related scientific and technical information in this document regarding the Mount Milligan Mine were prepared in accordance with the standards of NI 43-101 and were prepared, reviewed, verified and compiled by C. Paul Jago, Member of the Engineers and Geoscientists British Columbia, Exploration Manager at Centerra’s Mount Milligan Mine, who is the qualified person for the purpose of NI 43-101. Sample preparation, analytical techniques, laboratories used, and quality assurance quality control protocols used during the exploration drilling programs are done consistent with industry standards and independent certified assay labs are used. The Mount Milligan deposit is described in the 2019 Annual Information Form and a technical report dated March 26, 2020 (with an effective date of December 31, 2019) prepared in accordance with NI 43-101, both of which are available on SEDAR at www.sedar.com.
Exploration information and related scientific and technical information in this document regarding the Öksüt Gold Mine were prepared, reviewed, verified and compiled in accordance with NI 43-101 by Mustafa Cihan, Member of the Australian Institute of Geoscientists (AIG), Exploration Manager Turkey at Centerra’s Turkish subsidiary Centerra Madencilik A.Ş., who is the qualified person for the purpose of NI 43-101. Sample preparation, analytical techniques, laboratories used, and quality assurance-quality control protocols used during the exploration drilling programs are done consistent with industry standards and independent certified assay labs are used. The Öksüt deposit is described in Centerra’s most recently filed Annual Information Form and in a technical report dated September 3, 2015 (with an effective date of June 30, 2015) prepared in accordance with NI 43-101, both of which are available on SEDAR at www.sedar.com.
For more information:
John W. Pearson
Vice President, Investor Relations
Centerra Gold Inc.
(416) 204-1953
john.pearson@centerragold.com
Additional information on Centerra is available on the Company’s web site at www.centerragold.com and at SEDAR at www.sedar.com.
osts on a by-product basis (including and excluding taxes) per ou

Key Currencies vs. the US Dollar
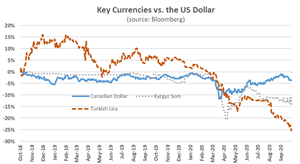
Key Currencies vs. the US Dollar
Kumtor Q3 cash provided by mine operations
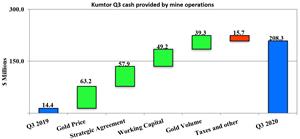
Kumtor Q3 cash provided by mine operations
Kumtor Q3 All-in sustaining costs on a by-product basis per ounce sold (non-GAAP)
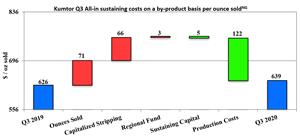
Kumtor Q3 All-in sustaining costs on a by-product basis per ounce sold (non-GAAP)
Kumtor YTD cash provided by operations
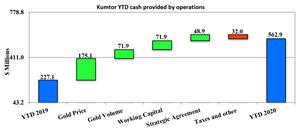
Kumtor YTD cash provided by operations
Kumtor YTD All-in sustaining costs on a by-product basis per ounce sold (non-GAAP)
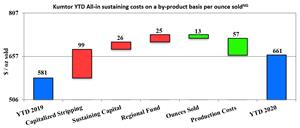
Kumtor YTD All-in sustaining costs on a by-product basis per ounce sold (non-GAAP)
Water Inventory
Water Inventory
Mount Milligan Q3 cash provided by mine operations
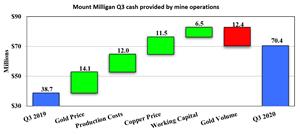
Mount Milligan Q3 cash provided by mine operations
Mount Milligan Q3 All-in sustaining costs on a by-product basis per ounce sold (non-GAAP)
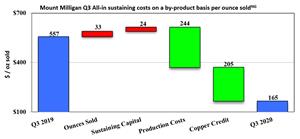
Mount Milligan Q3 All-in sustaining costs on a by-product basis per ounce sold (non-GAAP)
Mount Milligan YTD cash provided by mine operations
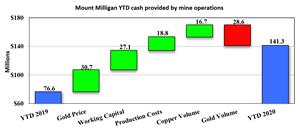
Mount Milligan YTD cash provided by mine operations
Mount Milligan YTD All-in sustaining costs on a by-product basis per ounce sold (non-GAAP)
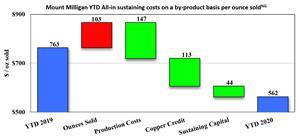
Mount Milligan YTD All-in sustaining costs on a by-product basis per ounce sold (non-GAAP)
Moly Oxide Weekly Pricing