CHICAGO, Oct. 1, 2020 /PRNewswire/ -- Today Conagra Brands, Inc. (NYSE: CAG) reported results for the first quarter of fiscal year 2021, which ended on August 30, 2020. All comparisons are against the prior-year fiscal period, unless otherwise noted. Certain terms used in this release, including "Organic net sales," "EBITDA," "Legacy Pinnacle," and certain "adjusted" results, are defined under the section entitled "Definitions." See page 6 for more information.
Highlights
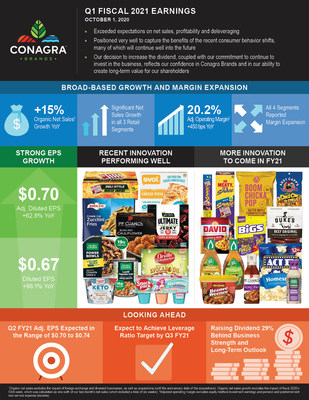
- First quarter net sales increased 12.1%, and organic net sales increased 15.0%, with significant growth in each of the Company's three retail segments on both a reported and an organic basis.
- All four of the Company's segments reported margin expansion in the quarter. Total Company operating margin increased 800 basis points to 19.0%, and adjusted operating margin increased 450 basis points to 20.2%.
- Diluted earnings per share from continuing operations (EPS) for the first quarter grew 86.1% to $0.67, and adjusted EPS grew 62.8% to $0.70.
- Subsequent to quarter-end, the Company's board of directors approved a 29% increase in the quarterly dividend to $0.275 per share, or $1.10 per share on an annualized basis. The increase was enabled by the Company's de-leveraging progress, which is ahead of its expected cadence, and reflects management's ongoing confidence in the long-term strength of the business.
- The Company is providing guidance for the second quarter of fiscal 2021:
- Organic net sales growth is expected in the range of +6% to +8%
- Adjusted operating margin is expected in the range of 18.0% to 18.5%
- Adjusted EPS is expected in the range of $0.70 to $0.74
- The Company expects to reach its net leverage ratio target of 3.5x to 3.6x by the third quarter of fiscal 2021.
- The Company is reaffirming its fiscal 2022 algorithm.
CEO Perspective
Sean Connolly, president and chief executive officer of Conagra Brands, commented, "Fiscal 2021 is off to a strong start. Our first quarter results demonstrate that our business is healthy, our products are relevant, and our capabilities are strong. We exceeded our expectations on net sales, profitability, and de-leveraging, and continued to make investments to ensure the physical availability of our products, maintain momentum with consumers, and build brand health. Now that customers have begun rebuilding inventories and we have increased production capacity in certain areas of our business, we are selectively increasing our marketing support for the businesses where capacity permits. These investments are intended to help sustain brand momentum and maximize the long-term value of our consumer base."
He continued, "Our execution of the Conagra Way for the past five years has positioned us very well to capture the benefits of the recent consumer behavior shifts, many of which we believe will continue well into the future. Our decision to increase the dividend, coupled with our commitment to continue to invest in the business, reflects our confidence in Conagra Brands and in our ability to create long-term value for our shareholders."
Total Company First Quarter Results
In the quarter, net sales increased 12.1% to $2.7 billion. The growth in reported net sales primarily reflects:
- a 2.4% net decrease from the divestitures of the Direct Store Delivery (DSD) snacks business, the Lender's Bagel business, and the exit of the private label peanut butter business (collectively, the Sold Businesses);
- a 0.5% net decrease due to foreign exchange; and
- a 15.0% increase in organic net sales.
The 15.0% increase in organic net sales was driven by a 10.9% increase in volume and a favorable price/mix impact of 4.1%. The volume increase was primarily driven by consumers increasing their at-home food consumption as a result of the COVID-19 pandemic, which benefitted the Company's retail segments but negatively impacted the Foodservice segment. The price/mix favorability was driven by favorable pricing and sales mix; approximately 70 bps of the increase in net sales and organic net sales reflects a change in estimate associated with the prior quarter's trade expense accrual.
Gross profit increased 21.9% to $810 million in the quarter, and adjusted gross profit increased 21.7% to $823 million. Gross margin increased 245 basis points to 30.2% in the quarter, and adjusted gross margin increased 244 basis points to 30.7%. The net sales increase, together with supply chain realized productivity, favorable margin mix, cost synergies associated with the Pinnacle Foods acquisition, and fixed cost leverage combined to more than offset higher input costs, COVID-19-related expenses, the impact of foreign exchange, and lost profit from the Sold Businesses. The previously mentioned change in trade expense estimate increased adjusted gross margin by approximately 40 basis points in the quarter.
Selling, general, and administrative expense (SG&A), which includes advertising and promotional expense (A&P), decreased 25.1% to $300 million in the quarter. Adjusted SG&A, which excludes A&P, decreased 7.6% to $237 million, primarily as a result of cost synergies associated with the Pinnacle Foods acquisition as well as temporarily reduced spending as employees worked from home and business travel was eliminated. A&P for the quarter increased 1.5% to $46 million.
Net interest expense was $114 million in the quarter. Compared to the prior-year period, net interest expense decreased 7.3% to $9 million, driven by lower levels of debt outstanding.
The Company's 490 million average diluted shares outstanding was an increase of approximately 2 million shares versus the prior-year period.
In the quarter, net income attributable to Conagra Brands increased 89.4% to $329 million, or $0.67 per diluted share. Adjusted net income attributable to Conagra Brands increased 64.2% to $344 million, or $0.70 per diluted share, in the quarter. The increases were driven primarily by the increase in gross profit and reduction in SG&A. The increase in adjusted EPS in the quarter was primarily driven by the increase in adjusted net income attributable to Conagra Brands, slightly offset by higher average diluted shares outstanding.
Adjusted EBITDA, which includes equity method investment earnings and pension and postretirement non-service income, increased 34.5% to $647 million in the quarter primarily driven by the previously mentioned increase in adjusted Gross Profit and decrease in adjusted SG&A.
Grocery & Snacks Segment First Quarter Results
Net sales for the Grocery & Snacks segment increased 16.0% to $1.1 billion in the quarter reflecting:
- a 4.7% decrease from the impact of the Sold Businesses; and
- a 20.7% increase in organic net sales.
On an organic net sales basis, volume increased 17.2% and price/mix increased 3.5%. Volume benefited from increased at-home eating and replenishment of customer inventory levels. The increase in price/mix was primarily driven by favorable pricing and mix as well as the previously mentioned change in trade expense estimate. Many grocery and snack brands experienced strong double-digit organic sales growth in the quarter, including Hunts, PAM, Vlasic, Duncan Hines, Wishbone, Slim Jim, Orville Redenbacher's, Act II, Swiss Miss, and Snack Pack.
Operating profit for the segment increased 86.9% to $284 million in the quarter. Adjusted operating profit increased 43.0% to $298 million, primarily driven by organic net sales growth, supply chain realized productivity, and cost synergies associated with the Pinnacle Foods acquisition. These benefits were partially offset by input cost inflation, COVID-19-related costs, and the lost profit from the Sold Businesses.
Refrigerated & Frozen Segment First Quarter Results
Net sales for the Refrigerated & Frozen segment increased 17.9% to $1.1 billion in the quarter reflecting:
- a 1.1% decrease from the impact of the Sold Businesses; and
- a 19.0% increase in organic net sales.
On an organic net sales basis, volume increased 12.8% and price/mix increased 6.2%. Volume benefited from increased at-home eating and replenishment of customer inventory levels. The price/mix increase was primarily driven by favorable pricing and mix as well as the previously mentioned change in trade expense estimate. Many brands, including Birds Eye, Marie Callender's, Hungry Man, Healthy Choice, P.F. Chang's Home Menu, Odom's Tennessee Pride, Gardein, Hebrew National, and Reddi-wip experienced strong double-digit organic net sales growth in the quarter.
Operating profit for the segment increased 54.3% to $240 million in the quarter. Adjusted operating profit increased 42.8% to $246 million as the benefits of higher organic net sales, supply chain realized productivity, and cost synergies associated with the Pinnacle Foods acquisition more than offset higher input costs, COVID-19-related costs, and lost profit from the Sold Businesses.
International Segment First Quarter Results
Net sales for the International segment increased 7.2% to $219 million in the quarter reflecting:
- a 5.9% decrease from the unfavorable impact of foreign exchange; and
- a 13.1% increase in organic net sales.
On an organic net sales basis, volume increased 10.5% and price/mix increased 2.6%. During the quarter, the segment benefited from elevated demand related to the impacts of the pandemic, and the segment experienced strong growth in each of its regions. The segment also benefitted from the previously mentioned change in trade expense estimate.
Operating profit for the segment increased 55.5% to $39 million in the quarter. Adjusted operating profit increased 47.7% to $38 million as the increase in organic net sales, together with the benefits from favorable product mix and supply chain realized productivity were only partially offset by higher input costs and the impact of foreign exchange.
Foodservice Segment First Quarter Results
Net sales for the Foodservice segment decreased 21.8% to $195 million in the quarter reflecting:
- a 1.5% decrease from the impact of the Sold Businesses; and
- a 20.3% decrease in organic net sales.
On an organic net sales basis, volume decreased 24.2% primarily driven by lower restaurant traffic as a result of the COVID-19 pandemic. Price/mix was favorable 3.9% in the quarter primarily driven by favorable mix and increased pricing to offset higher input costs.
Operating profit for the segment decreased 20.0% to $25 million in the quarter, as the impacts of lower organic net sales and higher input costs more than offset the impacts of supply chain realized productivity, lower inventory write-offs, and cost synergies associated with the Pinnacle Foods acquisition.
Other First Quarter Items
Corporate expenses decreased 22.5% to $77 million in the quarter, primarily driven by lower corporate restructuring expense. Adjusted corporate expense increased 5.6% to $66 million in the quarter, as higher share-based payment and deferred compensation expense more than offset the benefit of cost synergies associated with the Pinnacle Foods acquisition.
Pension and post-retirement non-service income was $14 million in the quarter compared to $10 million of income in the prior-year period.
In the quarter, equity method investment earnings were $6.5 million. On a reported basis, the 46.8% decrease was primarily driven by a gain on the sale of an asset in the prior year. On an adjusted basis, the 4.5% decrease was primarily driven by less favorable market conditions in the Ardent Mills joint venture.
In the quarter, the effective tax rate was 20.8%, and the adjusted effective tax rate was 22.8%.
In the quarter, the Company paid a dividend of $0.2125 per share.
The Company remains committed to a solid investment grade credit rating. Since the closing of the Pinnacle Foods acquisition through the end of the first quarter of fiscal 2021, the Company has reduced total gross debt by more than $1.9 billion, resulting in total debt of $9.6 billion and net debt of $9.2 billion as of the end of the first quarter of fiscal 2021. In the last four fiscal quarters ending August 30, 2020, the Company generated $995 million in Net income attributable to Conagra Brands. As of the first quarter of fiscal 2021, the Company's net debt to last twelve month adjusted EBITDA ratio was 3.7x.
Dividend Increase
Subsequent to quarter-end, the Company's board of directors approved a quarterly dividend payment of $0.275 per share of Conagra common stock to be paid on December 2, 2020 to stockholders of record as of the close of business on November 2, 2020.
Portfolio Update
On September 28, 2020, the Company entered into a definitive agreement to sell its H.K. Anderson business to Utz Quality Foods, LLC. The transaction is subject to customary closing conditions and is expected to be completed in the second quarter of fiscal 2021. In fiscal 2020, the business generated approximately $10 million in net sales and was primarily reported in the Grocery & Snacks segment.
Outlook
The impact of the COVID-19 pandemic on the Company's full year fiscal 2021 consolidated results is uncertain. The Company continues to expect demand in retail to remain elevated and demand in foodservice to remain challenged versus historical norms. However, the degree and timing of changes in retail and foodservice demand levels are difficult to predict with enough certainty to provide a full-year outlook at this time.
In the second quarter to-date, the Company has continued to see a significant increase in demand in its retail segments. The Company has also continued to see reduced demand in its Foodservice segment when compared to pre-COVID-19 demand levels. COVID-19-related costs have also continued to impact the business. Based on these factors, the Company is providing second quarter fiscal 2021 guidance of:
- Organic net sales growth of +6% to +8%
- Adjusted operating margin of 18.0% to 18.5%
- Adjusted EPS of $0.70 to $0.74
The Company's second quarter guidance continues to assume that the end-to-end supply chain operates effectively during this period of heightened demand.
The Company expects to achieve its leverage ratio target of 3.5x to 3.6x by the third quarter of fiscal 2021.
The Company is reaffirming its fiscal 2022 algorithm of:
- Organic net sales growth (3-year CAGR ending fiscal 2022) of +1% to +2%
- Adjusted operating margin of 18% to 19%
- Adjusted EPS of $2.66 to $2.76
- Free cash flow conversion (percentage of adjusted net income 3-year average) of 95%+
The inability to predict the amount and timing of the impacts of foreign exchange, acquisitions, divestitures, and other items impacting comparability makes a detailed reconciliation of forward-looking non-GAAP financial measures impracticable. Please see the end of this release for more information.
Items Affecting Comparability of EPS
The following are included in the $0.67 EPS for the first quarter of fiscal 2021 (EPS amounts rounded and after tax). Please see the reconciliation schedules at the end of this release for additional details.
- Approximately $0.04 per diluted share of net expense related to restructuring plans
- Approximately $0.02 per diluted share of net benefit related to unusual tax items
- Approximately $0.01 per diluted share of net expense due to rounding
The following are included in the $0.36 EPS for the first quarter of fiscal 2020 (EPS amounts rounded and after tax). Please see the reconciliation schedules at the end of this release for additional details.
- Approximately $0.08 per diluted share of net expense related to restructuring plans
- Approximately $0.01 per diluted share of net expense related to corporate hedging activity
- Approximately $0.01 per diluted share of net benefit related to a gain on an asset sale in the Ardent Mills joint venture
- Approximately $0.06 per diluted share of net expense related to an impairment of goodwill associated with the planned divestiture of the DSD snacks business
- Approximately $0.03 per diluted share of net expense related to an impairment of intangible assets
- Approximately $0.10 per diluted share of net benefit related to unusual tax items primarily related to the reorganization of various Legacy Pinnacle legal entities and state tax planning strategies
Definitions
Organic net sales excludes, from reported net sales, the impacts of foreign exchange, divested businesses and acquisitions, as well as the impact of any 53rd week. All references to changes in volume and price/mix throughout this release are on an organic net sales basis.
References to adjusted items throughout this release refer to measures computed in accordance with GAAP less the impact of items impacting comparability. Items impacting comparability are income or expenses (and related tax impacts) that management believes have had, or are likely to have, a significant impact on the earnings of the applicable business segment or on the total corporation for the period in which the item is recognized, and are not indicative of the Company's core operating results. These items thus affect the comparability of underlying results from period to period.
References to earnings before interest, taxes, depreciation, and amortization (EBITDA) refer to net income attributable to Conagra Brands before the impacts of discontinued operations, income tax expense (benefit), interest expense, depreciation, and amortization. References to adjusted EBITDA refer to EBITDA before the impacts of items impacting comparability.
References to Legacy Pinnacle refer to either business or income and expenses that were a part of the acquired Pinnacle Foods business and exclude any income or expense associated with the Legacy Conagra business.
Discussion of Results
Conagra Brands will host a webcast and conference call at 9:30 a.m. Eastern time today to discuss the results. The live audio webcast and presentation slides will be available on www.conagrabrands.com/investor-relations under Events & Presentations. The conference call may be accessed by dialing 1-877-883-0383 for participants in the U.S. and 1-412-902-6506 for all other participants and using passcode 5016282. Please dial in 10 to 15 minutes prior to the call start time. Following the Company's remarks, the conference call will include a question-and-answer session with the investment community. A replay of the webcast will be available on www.conagrabrands.com/investor-relations under Events & Presentations until October 1, 2021.
About Conagra Brands
Conagra Brands, Inc. (NYSE: CAG), headquartered in Chicago, is one of North America's leading branded food companies. Guided by an entrepreneurial spirit, Conagra Brands combines a rich heritage of making great food with a sharpened focus on innovation. The company's portfolio is evolving to satisfy people's changing food preferences. Conagra's iconic brands, such as Birds Eye®, Marie Callender's®, Banquet®, Healthy Choice®, Slim Jim®, Reddi-wip®, and Vlasic®, as well as emerging brands, including Angie's® BOOMCHICKAPOP®, Duke's®, Earth Balance®, Gardein®, and Frontera®, offer choices for every occasion. For more information, visit www.conagrabrands.com.
Note on Forward-looking Statements
This document contains forward-looking statements within the meaning of the federal securities laws. These forward-looking statements are based on management's current expectations and are subject to uncertainty and changes in circumstances. Readers of this document should understand that these statements are not guarantees of performance or results. Many factors could affect our actual financial results and cause them to vary materially from the expectations contained in the forward-looking statements, including those set forth in this document. These risks, uncertainties, and factors include, among other things: the risk that the cost savings and any other synergies from the acquisition of Pinnacle Foods Inc. (the Pinnacle acquisition) may not be fully realized or may take longer to realize than expected; the risk that the Pinnacle acquisition may not be accretive within the expected timeframe or to the extent anticipated; the risks that the Pinnacle acquisition and related integration will create disruption to the Company and its management and impede the achievement of business plans; risks related to our ability to achieve the intended benefits of other recent acquisitions and divestitures; risks associated with general economic and industry conditions; risks associated with our ability to successfully execute our long-term value creation strategies; risks related to our ability to deleverage on currently anticipated timelines, and to continue to access capital on acceptable terms or at all; risks related to our ability to execute operating and restructuring plans and achieve targeted operating efficiencies from cost-saving initiatives, and to benefit from trade optimization programs; risks related to the effectiveness of our hedging activities and ability to respond to volatility in commodities; risks related to the Company's competitive environment and related market conditions; risks related to our ability to respond to changing consumer preferences and the success of our innovation and marketing investments; risks related to the ultimate impact of any product recalls and litigation, including litigation related to the lead paint and pigment matters, as well as any securities litigation, including securities class action lawsuits; risk associated with actions of governments and regulatory bodies that affect our businesses, including the ultimate impact of new or revised regulations or interpretations; risks related to the impact of the recent coronavirus (COVID-19) pandemic on our business, suppliers, consumers, customers and employees; risks related to the availability and prices of raw materials, including any negative effects caused by inflation, weather conditions or health pandemics; disruptions or inefficiencies in our supply chain and/or operations, including from the recent COVID-19 pandemic; risks associated with actions by our customers, including changes in distribution and purchasing terms; risks and uncertainties associated with intangible assets, including any future goodwill or intangible assets impairment charges; and other risks described in our reports filed from time to time with the Securities and Exchange Commission. We caution readers not to place undue reliance on any forward-looking statements included in this report, which speak only as of the date of this report. We undertake no responsibility to update these statements, except as required by law.
Note on Non-GAAP Financial Measures
This document includes certain non-GAAP financial measures, including adjusted EPS, organic net sales, adjusted gross profit, adjusted operating profit, adjusted SG&A, adjusted corporate expenses, adjusted gross margin, adjusted operating margin, adjusted effective tax rate, adjusted net income attributable to Conagra Brands, adjusted pension and post-retirement non-service income, adjusted net interest expense, free cash flow, net debt, adjusted equity method investment earnings, net leverage ratio, and adjusted EBITDA. Management considers GAAP financial measures as well as such non-GAAP financial information in its evaluation of the Company's financial statements and believes these non-GAAP measures provide useful supplemental information to assess the Company's operating performance and financial position. These measures should be viewed in addition to, and not in lieu of, the Company's diluted earnings per share, operating performance and financial measures as calculated in accordance with GAAP.
Certain of these non-GAAP measures, such as organic net sales, adjusted operating margin, adjusted EPS, net debt, and net leverage ratio are forward-looking. Historically, the Company has excluded the impact of certain items impacting comparability, such as, but not limited to, restructuring expenses, the impact of the extinguishment of debt, the impact of foreign exchange, the impact of acquisitions and divestitures, hedging gains and losses, impairment charges, the impact of legacy legal contingencies, and the impact of unusual tax items, from the non-GAAP financial measures it presents. Reconciliations of these forward-looking non-GAAP financial measures to the most directly comparable GAAP financial measures are not provided because the Company is unable to provide such reconciliations without unreasonable effort, due to the uncertainty and inherent difficulty of predicting the occurrence and the financial impact of such items impacting comparability and the periods in which such items may be recognized. For the same reasons, the Company is unable to address the probable significance of the unavailable information, which could be material to future results.
Hedge gains and losses are generally aggregated, and net amounts are reclassified from unallocated corporate expense to the operating segments when the underlying commodity or foreign currency being hedged is expensed in segment cost of goods sold. The Company identifies these amounts as items that impact comparability within the discussion of unallocated Corporate results.
For more information, please contact:
MEDIA: Mike Cummins
312-549-5257
Michael.Cummins@conagra.com
INVESTORS: Brian Kearney
312-549-5002
IR@conagra.com
Conagra Brands, Inc. Consolidated Statements of Earnings (in millions) (unaudited) | ||||||||||||
FIRST QUARTER | ||||||||||||
Thirteen weeks | Thirteen weeks | |||||||||||
August 30, 2020 | August 25, 2019 | Percent Change | ||||||||||
Net sales | $ | 2,678.9 | $ | 2,390.7 | 12.1 | % | ||||||
Costs and expenses: | ||||||||||||
Cost of goods sold | 1,868.7 | 1,726.2 | 8.3 | % | ||||||||
Selling, general and administrative expenses | 300.3 | 400.8 | (25.1) | % | ||||||||
Pension and postretirement non-service expense (income) | (13.8) | (9.5) | 45.9 | % | ||||||||
Interest expense, net | 113.7 | 122.7 | (7.3) | % | ||||||||
Income before income taxes and equity method investment earnings | 410.0 | 150.5 | 172.4 | % | ||||||||
Income tax expense (benefit) | 86.7 | (11.5) | N/A | |||||||||
Equity method investment earnings | 6.5 | 12.3 | (46.8) | % | ||||||||
Net income | $ | 329.8 | $ | 174.3 | 89.3 | % | ||||||
Less: Net income attributable to noncontrolling interests | 0.8 | 0.5 | 75.2 | % | ||||||||
Net income attributable to Conagra Brands, Inc. | $ | 329.0 | $ | 173.8 | 89.4 | % | ||||||
Earnings per share - basic | ||||||||||||
Net income attributable to Conagra Brands, Inc. | $ | 0.67 | $ | 0.36 | 86.1 | % | ||||||
Weighted average shares outstanding | 488.2 | 486.8 | 0.3 | % | ||||||||
Earnings per share - diluted | ||||||||||||
Net income attributable to Conagra Brands, Inc. | $ | 0.67 | $ | 0.36 | 86.1 | % | ||||||
Weighted average share and share equivalents outstanding | 489.9 | 487.9 | 0.4 | % | ||||||||
Conagra Brands, Inc. Consolidated Balance Sheets (in millions) (unaudited) | ||||||||
August 30, 2020 | May 31, 2020 | |||||||
ASSETS | ||||||||
Current assets | ||||||||
Cash and cash equivalents | $ | 438.2 | $ | 553.3 | ||||
Receivables, less allowance for doubtful accounts of $2.5 and $2.6 | 807.8 | 860.8 | ||||||
Inventories | 1,579.6 | 1,376.6 | ||||||
Prepaid expenses and other current assets | 108.4 | 93.9 | ||||||
Current assets held for sale | 1.1 | 1.3 | ||||||
Total current assets | 2,935.1 | 2,885.9 | ||||||
Property, plant and equipment, net | 2,430.7 | 2,389.6 | ||||||
Goodwill | 11,439.6 | 11,433.9 | ||||||
Brands, trademarks and other intangibles, net | 4,302.9 | 4,315.5 | ||||||
Other assets | 1,263.3 | 1,273.4 | ||||||
Noncurrent assets held for sale | 5.7 | 5.7 | ||||||
$ | 22,377.3 | $ | 22,304.0 | |||||
LIABILITIES AND STOCKHOLDERS' EQUITY | ||||||||
Current liabilities | ||||||||
Notes payable | $ | 0.6 | $ | 1.1 | ||||
Current installments of long-term debt | 718.6 | 845.5 | ||||||
Accounts payable | 1,523.3 | 1,525.6 | ||||||
Accrued payroll | 110.4 | 189.4 | ||||||
Other accrued liabilities | 749.0 | 725.8 | ||||||
Total current liabilities | 3,101.9 | 3,287.4 | ||||||
Senior long-term debt, excluding current installments | 8,897.6 | 8,900.8 | ||||||
Other noncurrent liabilities | 2,178.8 | 2,165.1 | ||||||
Total stockholders' equity | 8,199.0 | 7,950.7 | ||||||
$ | 22,377.3 | $ | 22,304.0 | |||||
Conagra Brands, Inc. and Subsidiaries Condensed Consolidated Statements of Cash Flows (in millions) (unaudited) | ||||||||
Thirteen weeks ended | ||||||||
August 30, 2020 | August 25, 2019 | |||||||
Cash flows from operating activities: | ||||||||
Net income | $ | 329.8 | $ | 174.3 | ||||
Adjustments to reconcile net income to net cash flows from operating activities: | ||||||||
Depreciation and amortization | 95.2 | 96.7 | ||||||
Asset impairment charges | 3.4 | 67.0 | ||||||
Loss on divestiture | - | 1.7 | ||||||
Distributions in excess of earnings of affiliates | 4.0 | 0.2 | ||||||
Stock-settled share-based payments expense | 16.5 | 10.2 | ||||||
Contributions to pension plans | (5.9) | (3.4) | ||||||
Pension benefit | (9.6) | (5.7) | ||||||
Other items | 24.3 | (2.6) | ||||||
Change in operating assets and liabilities excluding effects of business acquisitions and dispositions: | ||||||||
Receivables | 52.4 | 41.7 | ||||||
Inventories | (202.8) | (198.0) | ||||||
Deferred income taxes and income taxes payable, net | 15.6 | (23.9) | ||||||
Prepaid expenses and other current assets | (16.7) | (16.1) | ||||||
Accounts payable | 20.8 | 94.3 | ||||||
Accrued payroll | (79.1) | (77.6) | ||||||
Other accrued liabilities | 36.6 | 48.2 | ||||||
Net cash flows from operating activities | 284.5 | 207.0 | ||||||
Cash flows from investing activities: | ||||||||
Additions to property, plant and equipment | (145.5) | (106.6) | ||||||
Sale of property, plant and equipment | 0.6 | 1.0 | ||||||
Purchase of marketable securities | (1.5) | (16.9) | ||||||
Sale of marketable securities | 3.4 | 18.2 | ||||||
Other items | 0.1 | (3.2) | ||||||
Net cash flows from investing activities | (142.9) | (107.5) | ||||||
Cash flows from financing activities: | ||||||||
Net short-term borrowings | (0.5) | 55.0 | ||||||
Repayment of long-term debt | (133.4) | (205.8) | ||||||
Payment of intangible asset financing arrangement | (12.9) | (13.6) | ||||||
Cash dividends paid | (103.5) | (103.3) | ||||||
Exercise of stock options and issuance of other stock awards, including tax withholdings | (9.3) | (3.1) | ||||||
Net cash flows from financing activities | (259.6) | (270.8) | ||||||
Effect of exchange rate changes on cash and cash equivalents and restricted cash | 2.9 | (0.6) | ||||||
Net change in cash and cash equivalents and restricted cash | (115.1) | (171.9) | ||||||
Cash and cash equivalents and restricted cash at beginning of period | 554.3 | 237.6 | ||||||
Cash and cash equivalents and restricted cash at end of period | $ | 439.2 | $ | 65.7 | ||||
Conagra Brands, Inc. Reconciliation of Non-GAAP Financial Measures to Reported Financial Measures (in millions) | ||||||||||||||||||||
Q1 FY21 | Grocery & | Refrigerated & Frozen | International | Foodservice | Total Conagra | |||||||||||||||
Net Sales | $ | 1,134.2 | $ | 1,130.6 | $ | 219.0 | $ | 195.1 | $ | 2,678.9 | ||||||||||
Impact of foreign exchange | — | — | 12.1 | — | 12.1 | |||||||||||||||
Organic Net Sales | $ | 1,134.2 | $ | 1,130.6 | $ | 231.1 | $ | 195.1 | $ | 2,691.0 | ||||||||||
Year-over-year change - Net Sales | 16.0 | % | 17.9 | % | 7.2 | % | (21.8) | % | 12.1 | % | ||||||||||
Impact of foreign exchange (pp) | — | — | 5.9 | — | 0.5 | |||||||||||||||
Net sales from divested businesses (pp) | 4.7 | 1.1 | — | 1.5 | 2.4 | |||||||||||||||
Organic Net Sales | 20.7 | % | 19.0 | % | 13.1 | % | (20.3) | % | 15.0 | % | ||||||||||
Volume (Organic) | 17.2 | % | 12.8 | % | 10.5 | % | (24.2) | % | 10.9 | % | ||||||||||
Price/Mix | 3.5 | % | 6.2 | % | 2.6 | % | 3.9 | % | 4.1 | % | ||||||||||
Q1 FY20 | Grocery & | Refrigerated & Frozen | International | Foodservice | Total Conagra | |||||||||||||||
Net Sales | $ | 977.6 | $ | 959.1 | $ | 204.4 | $ | 249.6 | $ | 2,390.7 | ||||||||||
Net sales from divested businesses | (37.8) | (9.1) | — | (4.7) | (51.6) | |||||||||||||||
Organic Net Sales | $ | 939.8 | $ | 950.0 | $ | 204.4 | $ | 244.9 | $ | 2,339.1 | ||||||||||
Q1 FY21 | Grocery & | Refrigerated | International | Foodservice | Corporate | Total Conagra | ||||||||||||||||||
Operating Profit | $ | 283.6 | $ | 240.1 | $ | 38.5 | $ | 24.9 | $ | (77.2) | $ | 509.9 | ||||||||||||
Restructuring plans | 13.9 | 5.7 | (0.1) | — | 6.4 | 25.9 | ||||||||||||||||||
Acquisitions and divestitures | — | — | — | — | 2.7 | 2.7 | ||||||||||||||||||
Consulting fees on tax matters | — | — | — | — | 1.5 | 1.5 | ||||||||||||||||||
Legal matters | — | — | — | — | (2.0) | (2.0) | ||||||||||||||||||
Corporate hedging derivative losses (gains) | — | — | — | — | 2.5 | 2.5 | ||||||||||||||||||
Adjusted Operating Profit | $ | 297.5 | $ | 245.8 | $ | 38.4 | $ | 24.9 | $ | (66.1) | $ | 540.5 | ||||||||||||
Operating Profit Margin | 25.0 | % | 21.2 | % | 17.6 | % | 12.8 | % | 19.0 | % | ||||||||||||||
Adjusted Operating Profit Margin | 26.2 | % | 21.7 | % | 17.5 | % | 12.8 | % | 20.2 | % | ||||||||||||||
Year-over-year % change - Operating Profit | 86.9 | % | 54.3 | % | 55.5 | % | (20.0) | % | (22.5) | % | 93.4 | % | ||||||||||||
Year-over year % change - Adjusted Operating Profit | 43.0 | % | 42.8 | % | 47.7 | % | (20.0) | % | 5.6 | % | 44.2 | % | ||||||||||||
Year-over-year bps change - Adjusted Operating Profit | 495 | bps | 380 | bps | 481 | bps | 28 | bps | 450 | bps | ||||||||||||||
Q1 FY20 | Grocery & | Refrigerated | International | Foodservice | Corporate | Total Conagra | ||||||||||||||||||
Operating Profit | $ | 151.7 | $ | 155.6 | $ | 24.8 | $ | 31.1 | $ | (99.5) | $ | 263.7 | ||||||||||||
Restructuring plans | 19.1 | 0.6 | 1.2 | — | 28.6 | 49.5 | ||||||||||||||||||
Acquisitions and divestitures | 0.7 | — | — | — | 1.2 | 1.9 | ||||||||||||||||||
Impairment on business held for sale | 31.4 | — | — | — | — | 31.4 | ||||||||||||||||||
Brand impairment charges | 3.5 | 15.8 | — | — | — | 19.3 | ||||||||||||||||||
Loss on divestiture of businesses | 1.7 | — | — | — | — | 1.7 | ||||||||||||||||||
Corporate hedging derivative losses (gains) | — | — | — | — | 7.2 | 7.2 | ||||||||||||||||||
Adjusted Operating Profit | $ | 208.1 | $ | 172.0 | $ | 26.0 | $ | 31.1 | $ | (62.5) | $ | 374.7 | ||||||||||||
Operating Profit Margin | 15.5 | % | 16.2 | % | 12.1 | % | 12.5 | % | 11.0 | % | ||||||||||||||
Adjusted Operating Profit Margin | 21.3 | % | 17.9 | % | 12.7 | % | 12.5 | % | 15.7 | % | ||||||||||||||
Conagra Brands, Inc. Reconciliation of Non-GAAP Financial Measures to Reported Financial Measures (in millions) | ||||||||||||||||||||||||||||||||
Q1 FY21 | Gross profit | Selling, general and administrative expenses | Operating | Income before | Income | Income | Net income | Diluted EPS from | ||||||||||||||||||||||||
Reported | $ | 810.2 | $ | 300.3 | $ | 509.9 | $ | 410.0 | $ | 86.7 | 20.8 | % | $ | 329.0 | $ | 0.67 | ||||||||||||||||
% of Net Sales | 30.2 | % | 11.2 | % | 19.0 | % | ||||||||||||||||||||||||||
Restructuring plans | 10.4 | 15.5 | 25.9 | 25.9 | 6.4 | 19.5 | 0.04 | |||||||||||||||||||||||||
Acquisitions and divestitures | — | 2.7 | 2.7 | 2.7 | 0.7 | 2.0 | — | |||||||||||||||||||||||||
Corporate hedging derivative losses (gains) | 2.5 | — | 2.5 | 2.5 | 0.6 | 1.9 | — | |||||||||||||||||||||||||
Advertising and promotion expenses 2 | — | 45.9 | — | — | — | — | — | |||||||||||||||||||||||||
Consulting fees on tax matters | — | 1.5 | 1.5 | 1.5 | 0.4 | 1.1 | — | |||||||||||||||||||||||||
Legal matters | — | (2.0) | (2.0) | (2.0) | (0.5) | (1.5) | — | |||||||||||||||||||||||||
Unusual tax items | — | — | — | — | 7.6 | (7.6) | (0.02) | |||||||||||||||||||||||||
Rounding | — | — | — | — | — | — | 0.01 | |||||||||||||||||||||||||
Adjusted | $ | 823.1 | $ | 236.7 | $ | 540.5 | $ | 440.6 | $ | 101.9 | 22.8 | % | $ | 344.4 | $ | 0.70 | ||||||||||||||||
% of Net Sales | 30.7 | % | 8.8 | % | 20.2 | % | ||||||||||||||||||||||||||
Year-over-year % of net sales change - reported | 245 | bps | (555) | bps | 800 | bps | ||||||||||||||||||||||||||
Year-over-year % of net sales change - adjusted | 244 | bps | (188) | bps | 450 | bps | ||||||||||||||||||||||||||
Year-over-year change - reported | 21.9 | % | (25.1) | % | 93.4 | % | 172.4 | % | N/A | 89.4 | % | 86.1 | % | |||||||||||||||||||
Year-over-year change - adjusted | 21.7 | % | (7.6) | % | 44.2 | % | 68.1 | % | 73.4 | % | 64.2 | % | 62.8 | % | ||||||||||||||||||
Q1 FY20 | Gross profit | Selling, general and administrative expenses | Operating | Income before | Income | Income | Net income | Diluted EPS from | ||||||||||||||||||||||||
Reported | $ | 664.5 | $ | 400.8 | $ | 263.7 | $ | 150.5 | $ | (11.5) | (7.0) | % | $ | 173.8 | $ | 0.36 | ||||||||||||||||
% of Net Sales | 27.8 | % | 16.8 | % | 11.0 | % | ||||||||||||||||||||||||||
Restructuring plans | 4.5 | 45.0 | 49.5 | 50.1 | 11.5 | 38.6 | 0.08 | |||||||||||||||||||||||||
Acquisitions and divestitures | — | 1.9 | 1.9 | 1.9 | 0.5 | 1.4 | — | |||||||||||||||||||||||||
Corporate hedging derivative losses (gains) | 7.2 | — | 7.2 | 7.2 | 1.8 | 5.4 | 0.01 | |||||||||||||||||||||||||
Advertising and promotion expenses 2 | — | 45.3 | — | — | — | — | — | |||||||||||||||||||||||||
Gain on Ardent JV asset sale | — | — | — | — | (1.3) | (4.1) | (0.01) | |||||||||||||||||||||||||
Impairment of a business held for sale | — | 31.4 | 31.4 | 31.4 | 1.8 | 29.6 | 0.06 | |||||||||||||||||||||||||
Brand impairment charges | — | 19.3 | 19.3 | 19.3 | 4.5 | 14.8 | 0.03 | |||||||||||||||||||||||||
Loss on divestiture of businesses | — | 1.7 | 1.7 | 1.7 | 0.4 | 1.3 | — | |||||||||||||||||||||||||
Unusual tax items | — | — | — | — | 51.0 | (51.0) | (0.10) | |||||||||||||||||||||||||
Adjusted | $ | 676.2 | $ | 256.2 | $ | 374.7 | $ | 262.1 | $ | 58.7 | 21.8 | % | $ | 209.8 | $ | 0.43 | ||||||||||||||||
% of Net Sales | 28.3 | % | 10.7 | % | 15.7 | % | ||||||||||||||||||||||||||
1 Operating profit is derived from taking Income from continuing operations before income taxes and equity method investment earnings, adding back Interest expense, net and removing Pension and postretirement non-service income. |
2 Advertising and promotion expense (A&P) has been removed from adjusted selling, general and administrative expense because this metric is used in reporting to management, and management believes this adjusted measure provides useful supplemental information to assess the Company's operating performance. Please note that A&P is not removed from adjusted profit measures. |
Conagra Brands, Inc. Reconciliation of Non-GAAP Financial Measures to Reported Financial Measures (in millions) | ||||||||||||
Q1 FY21 | Q1 FY20 | % Change | ||||||||||
Equity method investment earnings | $ | 6.5 | $ | 12.3 | (46.8) | % | ||||||
Gain on Ardent JV asset sale | — | (5.4) | ||||||||||
Adjusted equity method investment earnings | $ | 6.5 | $ | 6.9 | (4.5) | % | ||||||
Q1 FY21 | Q1 FY20 | % Change | ||||||||||
Pension and postretirement non-service income | $ | (13.8) | $ | (9.5) | 45.9 | % | ||||||
Restructuring plans | — | (0.6) | ||||||||||
Adjusted pension and postretirement non-service income | $ | (13.8) | $ | (10.1) | 37.1 | % | ||||||
Q2 FY19 | Q4 FY19 | Q4 FY20 | Q1 FY21 | |||||||||||
Notes payable | $ | 0.9 | $ | 1.0 | $ | 1.1 | $ | 0.6 | ||||||
Current installments of long-term debt | 17.2 | 20.6 | 845.5 | 718.6 | ||||||||||
Senior long-term debt, excluding current installments | 11,349.5 | 10,459.8 | 8,900.8 | 8,897.6 | ||||||||||
Subordinated debt | 195.9 | 195.9 | — | — | ||||||||||
Total Debt | $ | 11,563.5 | $ | 10,677.3 | $ | 9,747.4 | $ | 9,616.8 | ||||||
Less: Cash | 442.3 | 236.6 | 553.3 | 438.2 | ||||||||||
Net Debt | $ | 11,121.2 | $ | 10,440.7 | $ | 9,194.1 | $ | 9,178.6 | ||||||
Q1 FY21 | Q1 FY20 | % Change | ||||||||||
Net income attributable to Conagra Brands, Inc. | $ | 329.0 | $ | 173.8 | 89.4 | % | ||||||
Add Back: Income tax expense | 86.7 | (11.5) | ||||||||||
Income tax expense attributable to noncontrolling interests | (0.3) | (0.2) | ||||||||||
Interest expense, net | 113.7 | 122.7 | ||||||||||
Depreciation | 80.3 | 81.7 | ||||||||||
Amortization | 14.9 | 15.0 | ||||||||||
Earnings before interest, taxes, depreciation, and amortization | $ | 624.3 | $ | 381.5 | 63.7 | % | ||||||
Restructuring plans 1 | 18.3 | 43.8 | ||||||||||
Acquisitions and divestitures | 2.7 | 1.9 | ||||||||||
Corporate hedging derivative losses (gains) | 2.5 | 7.2 | ||||||||||
Consulting fees on tax matters | 1.5 | — | ||||||||||
Brand impairment charges | — | 19.3 | ||||||||||
Loss on divestiture of businesses | — | 1.7 | ||||||||||
Impairment of a business held for sale | — | 31.4 | ||||||||||
Legal matters | (2.0) | — | ||||||||||
Gain on Ardent JV asset sale | — | (5.4) | ||||||||||
Adjusted Earnings before interest, taxes, depreciation, and amortization | $ | 647.3 | $ | 481.4 | 34.5 | % | ||||||
1 Excludes comparability items related to depreciation. |
Conagra Brands, Inc. Reconciliation of Non-GAAP Financial Measures to Reported Financial Measures (in millions) | ||||
Q1 FY21 LTM 2 | ||||
Net Debt | $ | 9,178.6 | ||
Net income attributable to Conagra Brands, Inc. | $ | 995.3 | ||
Add Back: Income tax expense | 299.5 | |||
Income tax expense attributable to noncontrolling interests | (1.0) | |||
Interest expense, net | 478.1 | |||
Depreciation | 327.7 | |||
Amortization | 59.7 | |||
Earnings before interest, taxes, depreciation, and amortization (EBITDA) | $ | 2,159.3 | ||
Restructuring plans 1 | 81.0 | |||
Acquisitions and divestitures | 6.1 | |||
Corporate hedging derivative losses | 0.8 | |||
Consulting fees on tax matters | 1.5 | |||
Pension settlement and valuation adjustment | 42.9 | |||
Impairment of a business held for sale | 27.6 | |||
Legal matters | 1.5 | |||
Environmental matters | 6.6 | |||
Contract settlement gain | (11.9) | |||
Brand impairment charges | 146.2 | |||
Gain on Ardent JV asset sale | 1.3 | |||
Adjusted EBITDA | $ | 2,462.9 | ||
Net Debt to Adjusted LTM EBITDA | 3.7 | |||
1 Excludes comparability items related to depreciation. |
2 Last twelve months |
August 30, 2020 | August 25, 2019 | % Change | ||||||||||
Net cash flows from operating activities | $ | 284.5 | $ | 207.0 | 37.4 | % | ||||||
Additions to property, plant and equipment | (145.5) | (106.6) | 36.5 | % | ||||||||
Free cash flow | $ | 139.0 | $ | 100.4 | 38.4 | % | ||||||
![]()
![]() View original content to download multimedia:http://www.prnewswire.com/news-releases/conagra-brands-reports-strong-first-quarter-results-301143549.html
View original content to download multimedia:http://www.prnewswire.com/news-releases/conagra-brands-reports-strong-first-quarter-results-301143549.html
SOURCE Conagra Brands, Inc.


