The Variability Program was designed to investigate the variability of the Marimaca ore body by assessing copper recovery, acid consumption and impurity dissolution characteristics within each mineralogical domain (ore type). This Program represents an important de-risking milestone for Marimaca by increasing certainty and predictability of the metallurgical response for each ore type and spatially across the deposit, and to refine process design criteria prior to the Feasibility Study targeted for 2022.
Highlights
- Results from the Variability Program demonstrate uniform metallurgical behaviour within each mineral zone when considering acid consumption and copper recoveries
- A total of 412 composites across each of the 5 mineral zones within the Marimaca Mineral Resource (Brochantite, Chrysocolla, WAD, Mixed and Enriched) were analyzed
- Results significantly improve the resolution of the Marimaca geo-metallurgical model and will allow for rigorous modeling of recovery and acid consumption across mine blocks ahead of the planned 2022 Feasibility Study
- The Program is a core component of the Company’s Phase 5 metallurgical testing program, the second program undertaken since the 2020 Preliminary Economic Assessment (“PEA”) (refer to announcement on
4 August 2020 ), which projected average life of mine metallurgical recoveries in the heap leach of approximately 76% - For the oxide mineral zones (BROC, CRIS, WAD), recoveries generally exceeded the solubility ratio and leaching potential of the samples (see Leaching Potential Overview), indicating a potentially larger proportion of the copper is acid soluble and will be recovered in commercial-scale heap leaching
- The Variability Program represents a significant de-risking milestone and will form the basis for defining recovery and processing assumptions for Feasibility Study and eventual operational mine plans
- MOD infill drilling is underway, and MOD Depth Extension (MAMIX) infill drilling is currently being planned
“One of the key risks of any project is variability in the metallurgical performance of a deposit when moving laterally or vertically. We have completed an incredibly rigorous programme encompassing over 400 hundred samples spread evenly across the deposit in both vertical and horizontal directions. This provides us with a significant amount of data to underpin our assumptions with respect to both the expected copper recoveries and acid consumption of each mining block.
“Importantly, the programme continues to give us a high degree of confidence that the assumptions used in our 2020 PEA, with respect to copper recoveries and acid consumptions, are valid. In fact, we have identified several areas for optimization and may see some improvement relative to the PEA assumptions.
“We have commenced the infill drilling campaign for the MOD and are currently planning for infill drilling the recently discovered deeper extensions of the MOD (MAMIX). The objective is to bring additional copper tonnes into an eventual updated Mineral Resource Estimate in the first half of 2022, which we will use as the basis for our Feasibility Study.”
Program Overview
A total of 412 variability composite samples were selected and analyzed for the Program. Samples were selected using spatial criteria across the PEA open-pit mineable resource area, subdivided into macroblocks of 75m x 75m x 25m (Figure 1). A total of 4,491 RC samples were processed through rigorous variability criteria screening and formed the basis for the 412 composites.
The program design consisted of three components:
- Chemical Head Characterization.
- Characterization included sequential copper analysis, leaching potential, soluble impurities, analytic acid consumption, and others
- Iso-pH Bottle Roll Tests
- Conducted under constant pH and Cl conditions to examine the correlation to the analytical acid consumption (AAC) diagnostic testing method, improve the acid consumption modeling, and review copper recovery relative to leaching potential
- 3 Acid Level Sensitivity Bottle Roll Test
- Conducted to examine copper recovery and acid consumption sensitivity relative to acid concentration
- Conducted to examine copper recovery and acid consumption sensitivity relative to acid concentration
Figure 1. Composite Sample Mineral Subzones
https://www.globenewswire.com/NewsRoom/AttachmentNg/2006a981-cf48-48b0-87ec-a4a14aab6efe
Results Discussion
Analytical Acid Consumption (AAC)
The average total AAC of the sample population was 40.79 kg/t with <10% of the samples returning an AAC of >60 kg/t. Green oxides tend to have a higher acid consumption than the balance of the mineral subzones (45-50 kg/t relative 30-40 kg/t). This difference is explained by marginal incremental carbonate content relative to WAD, MIX and ENR. All mineral subzones present low AAC variability and the same consistency was observed across the additional soluble impurities tested as part of the Analytical Acid Consumption assay (Fe, Al, Mg, Mn). In general, uniform behavior is observed within the mineral subzones.
Figure 2. Analytical Acid Consumption Test
https://www.globenewswire.com/NewsRoom/AttachmentNg/f875c978-4e30-46c4-9c98-c79459e0a0b0
Iso-pH tests
Similar to results observed in the Phase 4 metallurgical program, the majority of the composite samples returned recoveries that exceeded the solubility ratio, indicating that all of the acid soluble copper was recovered as well as additional copper not reported in the soluble copper assays. Additionally, the BROC, CRIS and WAD samples generally returned recoveries that exceeded the leaching potential, while the MIX and ENR samples reached recoveries between the solubility ratio and the leaching potential. WAD demonstrates the greatest recovery margin above the leaching potential. Currently this is interpreted as the presence of black oxides that are not detected in the head characterization tests but it can be recovered in longer tests given their slower leach kinetics. This can also be observed in the BROC and CRIS subzones, but to a lesser extent. Results observed for the MIX and ENR samples are as expected for the test conditions, as, to achieve higher recoveries of secondary sulfides, longer leach time or additional agglomeration and curing stages are required to increase recoveries.
Figure 3. Copper recovery vs. leaching potential
https://www.globenewswire.com/NewsRoom/AttachmentNg/202f9a48-0866-45b3-9020-4ce797517bbd
The iso-pH acid consumption test also demonstrated a strong correlation between when compared with the AAC test which provides strong validation for the results.
Figure 4. Acid consumption – AAC method vs. Iso-pH results
https://www.globenewswire.com/NewsRoom/AttachmentNg/aba392a8-f601-4709-a250-1e73fce77fdb
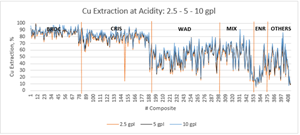
3 Acid Level Sensitivity Test
Copper recoveries did not demonstrate significant sensitivity to acid level test between 2.5 gpl, 5 gpt and 10 gpl. A slightly higher copper recovery is observed with higher acidity, but the effect is very limited. The sensitivity of acid consumption to acid level was higher than the copper recovery sensitivity. Acid consumption decreases materially at lower acidity. This is a known characteristic of the Marimaca ore and will play an important role in the processing plant operating condition design. Follow up tests are currently being designed to investigate further.
Figure 5. Acid level sensitivities
https://www.globenewswire.com/NewsRoom/AttachmentNg/f6e418eb-383c-4824-848f-e82a9c009a3b
Overview of Leaching Potential
The leaching potential of copper ores is defined as acid soluble copper (CuS) plus cyanide soluble copper (CuCN) divided by total copper (CuT). The acid solubility ratio (CuS/CuT) for copper oxides such as atacamite, brochantite and chrysocolla, which dissolve quickly when exposed to acid, is a good predictor of leachability. However, where the mineralization has several copper bearing minerals with different dissolution characteristics under these leaching conditions, the copper acid solubility ratio may materially underestimate the acid leaching potential for heap leach operations, especially where some copper sulphides such as chalcocite, covellite and bornite are present, as these sulphides can be partially dissolved under oxidation conditions.
For this reason, it is common to assay for cyanide soluble copper when assaying leachable copper mineralization. This gives an indication of the total leaching potential [(CuS + CuCN)/CuT] because cyanide dissolves some of the copper sulphides that may be present in the sample and assumes that, during the leaching operation, some oxidation reactions, such as, ferric leaching and/or cupric chloride leaching occur. Due to these reactions during sulphide leaching it can be inferred that copper dissolution in a leaching operation may materially exceed the copper acid solubility ratio identified.
Marimaca has conducted five phases of metallurgical testing and has noted that in several mineral subzones, especially those with higher proportions of black copper oxides, the metallurgical recovery has exceeded the leaching potentials identified in sequential copper analysis.
Qualified Person
The Qualified Person for technical information in this news release is
The QP confirms they have visited the project area, have reviewed relevant project information, is responsible for the information contained in this news release, and consents to its publication.
Contact Information
For further information please visit www.marimaca.com or contact:
+44 (0) 207 920 3150
marimaca@tavistock.co.uk
Forward Looking Statements
This news release includes certain “forward-looking statements” under applicable Canadian securities legislation. There can be no assurance that such statements will prove to be accurate, and actual results and future events could differ materially from those anticipated in such statements. Forward-looking statements reflect the beliefs, opinions and projections on the date the statements are made and are based upon a number of assumptions and estimates that, while considered reasonable by
Neither the

![]()
Figure 1.
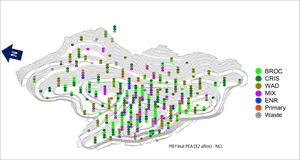
Composite Sample Mineral Subzones
Figure 2.
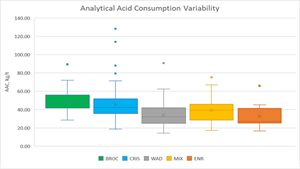
Analytical Acid Consumption Test
Figure 3.
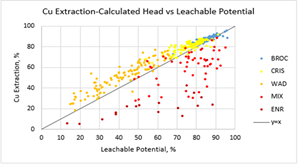
Copper recovery vs. leaching potential
Figure 4.
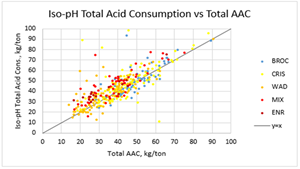
Acid consumption – AAC method vs. Iso-pH results
Figure 5.
Acid level sensitivities
2021 GlobeNewswire, Inc., source

