During Q3 2021, Pipestone delivered a third consecutive record quarter with respect to production, revenue, and cash flow, underpinned by the continued efficient execution of its organic development program. Commencing in Q4 2021, the Company expects to generate significant free cash flow, with forecast annual free cash flow of
THIRD QUARTER 2021 CORPORATE HIGHLIGHTS:
- In Q3 2021 Pipestone achieved record average quarterly production of 24,704 boe/d (30% condensate, 44% total liquids), a 6% quarterly increase over Q2 2021 and an 80% increase over Q3 2020. The record production was achieved despite a scheduled 10-day outage that occurred in July at one of the Company’s third-party processing plants;
- As a result of its continued production growth combined with improving commodity prices during the quarter, the Company generated record revenue of
$100.2 million , more than tripling revenue from Q3 2020 of$31.7 million , and an increase of$17.9 million or 22% from Q2 2021; - The Company realized a continued improvement in operating netback to a corporate record of
$22.01 /boe, an increase of 12% over Q2 2021 and a 122% increase over Q3 2020; - The Company also achieved record adjusted funds flow from operations of
$43.7 million ($0.23 per share basic and$0.16 per share fully diluted), almost a seven-fold increase of adjusted funds flow from operations of$6.4 million in Q3 2020, and an increase of$8.2 million or 23% from Q2 2021; - The Company continued the effective execution of its 2021 capital program with 7 Montney wells drilled and rig-released and 12 wells completed during the third quarter of 2021. Total capital expenditures, including capitalized G&A, were
$53.8 million during the three months endedSeptember 30, 2021 ; - The Company generated strong returns on invested capital, with Q3 2021 annualized ROCE and CROIC of 17.6% and 21.4%, respectively, as compared to a Q3 2020 annualized ROCE and CROIC of (1.3%) and 6.2%, respectively.
Subsequent to the quarter, and upon the redetermination of its Reserve Based Loan (the “RBL”), Pipestone upsized its borrowing capacity from
| Three months ended | Nine months ended | |||||||||||
| ($ thousands, except per unit and per share amounts) | 2021 | 2020 | 2021 | 2020 | ||||||||
| Financial | ||||||||||||
| Sales of liquids and natural gas | $ | 100,227 | $ | 31,700 | $ | 254,031 | $ | 90,097 | ||||
| Cash from operating activities | 34,225 | 660 | 86,054 | 31,552 | ||||||||
| Adjusted funds flow from operations (1) | 43,691 | 6,359 | 107,431 | 29,410 | ||||||||
| Per share, basic | 0.23 | 0.03 | 0.56 | 0.15 | ||||||||
| Per share, diluted (4) | 0.16 | 0.02 | 0.38 | 0.11 | ||||||||
| Income (loss) | 18,757 | (11,486 | ) | 16,613 | (15,431 | ) | ||||||
| Per share, basic | 0.10 | (0.06 | ) | 0.09 | (0.08 | ) | ||||||
| Per share, diluted (4) | 0.07 | (0.06 | ) | 0.06 | (0.08 | ) | ||||||
| Capital expenditures | 53,777 | 11,806 | 147,619 | 60,853 | ||||||||
| Property acquisitions | 8 | - | 295 | - | ||||||||
| Adjusted working capital deficit (end of period) (1) | $ | (31,814 | ) | $ | (15,934 | ) | ||||||
| Bank debt (end of period) | 187,724 | 120,477 | ||||||||||
| Net debt (end of period) (1) | 219,538 | 136,411 | ||||||||||
| Undrawn credit facility capacity (end of period) | 36,994 | 103,626 | ||||||||||
| Available funding (end of period) (1) | 5,180 | 87,692 | ||||||||||
| Shareholders’ equity (end of period) | 374,573 | 356,355 | ||||||||||
| Annualized cash return on invested capital (CROIC) (1) | 21.4 | % | 6.2 | % | 17.9 | % | 7.9 | % | ||||
| Annualized return on capital employed (ROCE) (1) | 17.6 | % | (1.3 | %) | 13.7 | % | 0.0 | % | ||||
| Shares outstanding (end of period) | 191,801 | 190,572 | ||||||||||
| Weighted-average basic shares outstanding | 191,692 | 190,468 | 191,353 | 190,150 | ||||||||
| Weighted-average diluted shares outstanding (4) | 280,480 | 273,172 | 279,900 | 272,945 | ||||||||
| Operations | ||||||||||||
| Production | ||||||||||||
| Condensate (bbls/d) | 7,399 | 4,265 | 7,251 | 4,334 | ||||||||
| Other natural gas liquids (NGLs) (bbls/d) | 3,434 | 2,196 | 3,133 | 1,923 | ||||||||
| Total NGLs (bbls/d) | 10,833 | 6,461 | 10,384 | 6,257 | ||||||||
| Crude oil (bbls/d) | 78 | 126 | 84 | 106 | ||||||||
| Natural gas (Mcf/d) | 82,755 | 42,683 | 76,532 | 50,876 | ||||||||
| Total (boe/d) (2) | 24,704 | 13,701 | 23,223 | 14,842 | ||||||||
| Condensate and crude oil (% of total production) | 30 | % | 32 | % | 32 | % | 30 | % | ||||
| Total liquids (% of total production) | 44 | % | 48 | % | 45 | % | 43 | % | ||||
| Benchmark prices | ||||||||||||
| Crude oil – WTI (C$/bbl) | $ | 88.88 | $ | 54.48 | $ | 81.07 | $ | 51.39 | ||||
| Condensate – Edmonton Condensate (C$/bbl) | 89.24 | 51.74 | 81.12 | 47.81 | ||||||||
| Natural gas – AECO 5A (C$/GJ) | 3.40 | 2.15 | 3.10 | 1.99 | ||||||||
| Average realized prices (3) | ||||||||||||
| Condensate (per bbl) | 85.30 | 48.24 | 75.89 | 42.67 | ||||||||
| Other NGLs (per bbl) | 37.15 | 16.41 | 30.46 | 14.57 | ||||||||
| Total NGLs (per bbl) | 70.03 | 37.42 | 62.18 | 34.03 | ||||||||
| Crude oil (per bbl) | 74.05 | 44.94 | 67.14 | 35.66 | ||||||||
| Natural gas (per Mcf) | 3.93 | 2.28 | 3.65 | 2.20 | ||||||||
| Netbacks | ||||||||||||
| Revenue (per boe) | 44.10 | 25.15 | 40.07 | 22.15 | ||||||||
| Realized (loss) gain on commodity risk | ||||||||||||
| management contracts (per boe) (5) | (6.79 | ) | (0.31 | ) | (5.46 | ) | 3.99 | |||||
| Royalties (per boe) | (1.70 | ) | (0.87 | ) | (1.20 | ) | (0.53 | ) | ||||
| Operating expenses (per boe) | (10.94 | ) | (10.26 | ) | (10.91 | ) | (10.77 | ) | ||||
| Transportation (per boe) | (2.66 | ) | (3.80 | ) | (2.67 | ) | (3.57 | ) | ||||
| Operating netback (per boe) (1) (5) | 22.01 | 9.91 | 19.83 | 11.27 | ||||||||
| Adjusted funds flow netback (per boe) (1) | $ | 19.22 | $ | 5.05 | $ | 16.94 | $ | 7.23 | ||||
| (1) | See “Non-GAAP measures” in the Advisories for a description. | |
| (2) | For a description of the boe conversion ratio, see “Basis of Barrel of Oil Equivalent”. References to crude oil in production amounts are to the product type “tight oil” and references to natural gas in production amounts are to the product type “shale gas”. References to total liquids include oil and natural gas liquids (including condensate, butane and propane). | |
| (3) | Figures calculated before hedging. | |
| (4) | Weighted-average number of diluted shares outstanding for the purpose of calculating diluted per share amounts in the 2021 periods presented includes 88,075,674 common shares that are issuable at the discretion of preferred shareholders as of | |
| (5) | Realized (loss) gain on commodity risk management contracts reclassified to be included under operating netback for 2021, prior period figures have been adjusted to conform with current presentation. |
2021 DEVELOPMENT PROGRAM UPDATE:
During
In early November, Pipestone completed the construction and commissioning of the previously announced
Sustained Capital Cost Performance: The 3 well 14-4 pad achieved an average drilling cost of
The drilling cost on the 3 new wells at the 6-13 pad averaged
Strong Well Performance: The six well 15-25 pad has achieved an IP90 of 445 bbl/d wellhead condensate and 4.5 MMcf/d raw gas (condensate gas ratio “CGR” of ~100 bbl/MMcf), which is in line with type curve expectations. The three well 8-15 pad has achieved an IP180 of 510 bbl/d wellhead condensate and 3.6 MMcf/d raw gas (CGR of 142 bbl/MMcf). The three well 14-4 pad, and the three well 6-13 pad both have had initial flow tests with very encouraging early time results. Both pads were placed on production in early November, and
2022 GUIDANCE & CORPORATE FORECAST UPDATE:(1)
An infographic accompanying this announcement is available at https://www.globenewswire.com/NewsRoom/AttachmentNg/cf8f45dc-4098-4944-a336-d85febd62e7b
In 2022,
| 2021 Guidance | 2022 Guidance | 2023 Forecast | ||
| Price Forecast | ||||
| Full Year Production (boe/d) | 24,000 – 26,000 | 34,000 – 36,000 | 37,000 – 40,000 | |
| AT Cash Flow (C$ MM) (2) | ||||
| Capex (C$ MM) (3) | ||||
| Free Cash Flow (C$ MM) (2) | ||||
| (Net Debt) / | ( | ( | ||
| LTM Debt / Cash Flow (x) | 1.1x | 0.2x | n.a | |
| 1) | 3-year plan as at | |
| 2) | See “Advisories Regarding Non-IFRS Measures”. Net debt excludes convertible preferred shares as there is no cash settled liability and includes adjusted working capital deficit. Forecast net debt / net cash does not incorporate the impact of any shareholder distributions. | |
| 3) | Capex includes all anticipated DCE&T, infrastructure and other capital expenditures, but excludes capitalized G&A. |
Illustrative 2022 Free Cash Flow Allocation:
Pipestone’s first priority is to deleverage the business, with a debt target of less than
An infographic accompanying this announcement is available at https://www.globenewswire.com/NewsRoom/AttachmentNg/c44b74fc-75ed-4d1d-a8a4-6a2590a8c5c6
Q3 2021 Financial Statements and Conference Call
Third quarter results are expected to be released before market open on
Conference Call Details:
Toll-Free: (866) 953-0776
International: (630) 652-5852
Conference ID: 1947358
President and Chief Executive Officer (587) 392-8407 paul.wanklyn@pipestonecorp.com | Chief Financial Officer (587) 392-8408 craig.nieboer@pipestonecorp.com |
VP Corporate Development (587) 392-8414 dan.vankessel@pipestonecorp.com |
Advisory Regarding Non-GAAP Measures
Non-GAAP measures
This press release includes references to financial measures commonly used in the oil and natural gas industry. The terms “adjusted funds flow from operations”, “cash flow”, “free cash flow”, “operating netback”, “adjusted funds flow netback”, “net debt”, “available funding”, “CROIC”, and “ROCE” are not defined under IFRS, which have been incorporated into Canadian GAAP, as set out in Part 1 of the Chartered Professional Accountants Canada Handbook – Accounting, are not separately defined under GAAP, and may not be comparable with similar measures presented by other companies. The reconciliations of these non-GAAP measures to the nearest GAAP measure are discussed in the MD&A dated
Management believes the presentation of the non-GAAP measures provide useful information to investors and shareholders as the measures provide increased transparency and the opportunity to better analyze and compare performance against prior periods.
Adjusted funds flow from operations
Cash flow
“Cash flow” is a non-GAAP measure that is calculated as cash from operating activities plus changes in non-cash working capital and decommissioning provision costs incurred, and is not defined under IFRS. Cash flow should not be considered an alternative to, or more meaningful than, cash from operating activities, income (loss) or other measures determined in accordance with IFRS as an indicator of the Company’s performance. Management uses cash flow to analyze operating performance and leverage and believes it is a useful supplemental measure as it provides an indication of the funds generated by Pipestone’s principal business activities prior to consideration of changes in working capital.
Free cash flow
“Free cash flow” is a non-GAAP measure that is calculated as cash from operating activities plus changes in non-cash working capital and decommissioning provision costs incurred, less capital expenditures incurred, and is not defined under IFRS. Free cash flow should not be considered an alternative to, or more meaningful than, cash from operating activities, income (loss) or other measures determined in accordance with IFRS as an indicator of the Company’s performance. Management uses free cash flow to analyze operating performance and leverage and believes it is a useful supplemental measure as it provides an indication of the funds generated by Pipestone’s principal business activities, inclusive of ongoing capital expenditures, prior to consideration of changes in working capital.
Operating netback and Adjusted funds flow netback
Operating netback is calculated on either a total dollar or per-unit-of-production basis and is determined by deducting royalties, operating and transportation expenses from liquids and natural gas sales adjusted for realized gains/losses on commodity risk management contracts.
Adjusted funds flow netback reflects adjusted funds flow from operations on a per-unit-of-production basis and is determined by dividing adjusted funds flow by total production on a per-boe basis. Adjusted funds flow netback can also be determined by deducting G&A, transaction costs, cash financing expenses, adding financing income and adjusting for realized gains/losses on interest rate risk management contracts on a per-unit-of-production basis from the operating netback. Refer to “Financial and Operating Results” section above for further details.
Operating netback and adjusted funds flow netback are common metrics used in the oil and natural gas industry and are used by Company management to measure operating results on a per boe basis to better analyze and compare performance against prior periods, as well as formulate comparisons against peers.
Net debt
Net debt is a non-GAAP measure that equals bank debt outstanding plus adjusted working capital. The Company does not consider its convertible preferred share obligation to be part of net debt as this represents a non-cash obligation that will ultimately be settled by conversion into
Available funding and Adjusted working capital
Available funding is comprised of adjusted working capital and undrawn portions of the Company’s RBL. Adjusted working capital is comprised of current assets less current liabilities on the Company’s consolidated statement of financial position and excludes the current portion of risk management contracts and lease liabilities. The available funding measure allows management and others to evaluate the Company’s short-term liquidity.
CROIC and ROCE
Adjusted EBITDA is calculated as profit or loss before interest, income taxes, depletion and depreciation, adjusted for certain non-cash and extraordinary items primarily relating to unrealized gains and losses on risk management contracts. Adjusted EBITDA is used to calculate CROIC. Adjusted EBIT is calculated as adjusted EBITDA less depletion and depreciation. Adjusted EBIT is used to calculate ROCE.
CROIC is determined by dividing adjusted EBITDA by the gross carrying value of the Company’s oil and gas assets at a point in time. For the purposes of the CROIC calculation, the net carrying value of the Company’s exploration and evaluation assets, property and equipment and ROU assets, is taken from the Company’s consolidated statement of financial position, and excludes accumulated depletion and depreciation as disclosed in the financial statement notes to determine the gross carrying value.
ROCE is determined by dividing adjusted EBIT by the carrying value of the Company’s net assets. For the purposes for the ROCE calculation, net assets are defined as total assets on the Company’s consolidated statement of financial position less current liabilities at a point in time.
CROIC and ROCE allow management and others to evaluate the Company’s capital spending efficiency and ability to generate profitable returns by measuring profit or loss relative to the capital employed in the business.
Advisory Regarding Forward-Looking Statements
In the interest of providing shareholders of
Forward-looking statements are not promises of future outcomes. There is no assurance that the results or events indicated or suggested by the forward-looking statements, or the plans, intentions, expectations or beliefs contained therein or upon which they are based, are correct or will in fact occur or be realized (or if they do, what benefits
In particular, but without limiting the foregoing, this news release contains forward-looking statements pertaining to: plans to accelerate capital expenditures and expected DUCs as of year-end; estimated production and increased free cash flow generation; revised 2021 production guidance and outlook; forecasted spending; guidance for 2022 and 2023, including production, capital expenditures, cash flow, free cash flow, reinvestment rate, net debt / net cash and LTDM Debt / Cash flow; plans for the repayment of debt; plans regarding a normal course issuer bid and forecast repurchases thereunder; DCE&T estimate for the 14-4 pad; timing for drilling 21 wells and completing 24 wells, and the associated cost and estimated production dates the connection date of Pipestone’s 6-30 pad to the
With respect to the forward-looking statements contained in this news release,
The forward-looking statements contained herein reflect management's current views, but the assessments and assumptions upon which they are based may prove to be incorrect. Although
Certain information in this news release is “financial outlook” within the meaning of applicable securities laws. The purpose of this financial outlook is to provide readers with disclosure of the company’s reasonable expectations of our anticipate results. The financial outlook is provided as of the date of this news release. Certain assumptions made underlying the financial outlook are disclosed herein under “2022 Guidance & Corporate Forecast Update”. Readers are cautioned that this financial outlook may not be appropriate for other purposes. The forward-looking statements contained in this news release are made as of the date hereof and
Initial Production Rates and Short-Term Test Rates
This document may disclose test rates of production for certain wells over short periods of time (i.e. IP90), which are preliminary and not determinative of the rates at which those or any other wells will commence production and thereafter decline. Short-term test rates are not necessarily indicative of long-term well or reservoir performance or of ultimate recovery. Although such rates are useful in confirming the presence of hydrocarbons, they are preliminary in nature, are subject to a high degree of predictive uncertainty as a result of limited data availability and may not be representative of stabilized on-stream production rates.
Production over a longer period will also experience natural decline rates, which can be high in the
Oil and Gas Measures
Basis of Barrel of Oil Equivalent
Petroleum and natural gas reserves and production volumes are stated as a “barrel of oil equivalent” (boe), derived by converting natural gas to oil equivalency in the ratio of 6,000 cubic feet of gas to one barrel of oil. Readers are cautioned that boe figures may be misleading, particularly if used in isolation. A boe conversion ratio of 6,000 cubic feet of gas to one barrel of oil is based on energy equivalency, which is primarily applicable at the burner tip, and does not represent a value equivalency at the wellhead.
CGR
Any references herein to “CGR” mean condensate/gas ratio and is expressed as a volume of condensate (expressed in barrels) per million cubic feet (mmcf) of natural gas.
DCE&T
This news release contains reference to DCE&T (drilling, completion, equip and tie-in costs), which does not have a standardized meaning or standard method of calculation and therefore such measure may not be comparable to similar measures used by other companies and should not be used to make comparisons. This metric has been included herein to provide readers with an additional measure to evaluate the Company's performance; however, this measure is not a reliable indicator of the future performance and future performance may not compare to the performance in previous periods and therefore such a metric should not be unduly relied upon. DCE&T includes all capital spent to drill, complete, equip and tie-in a well.
Production
References to natural gas and condensate production in this press release refer to the shale gas and natural gas liquids (which includes condensate), respectively, product types as defined in National Instrument 51-101, Standards of Disclosure for Oil and Gas Activities. References to liquids include tight oil and natural gas liquids (including condensate, butane and propane).
Disclosure of production on a per boe basis in this press release consists of the constituent product types and their respective quantities as disclosed in the following table:
| Condensate (bbls/d) | Other NGLs (bbls/d) | Total NGLs (bbls/d) | Crude Oil (1) (bbls/d) | Natural Gas (2) (MMcf/d) | Total (boe/d) | |
| Last 3 Days (Field Estimate) | 10,430 | 3,790 | 14,222 | n.m. (3) | 104 | 31,600 |
(1) References to crude oil in production amounts are to the product type “tight oil”.
(2) References to natural gas in production amounts are to the product type “shale gas”.
(3) NMN – not meaningful number.

![]()
Pipestone Development Map
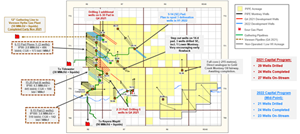
Pipestone Development Map
2022 Free Cash Flow Allocation
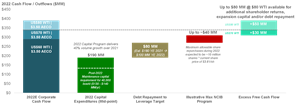
2022 Free Cash Flow Allocation
2021 GlobeNewswire, Inc., source

