PDF Available: http://ml.globenewswire.com/Resource/Download/8e0089e5-47ed-4362-8ef9-cb82d2b94108
| |||||
“I am extremely proud of the efforts of our team as we continue to safely navigate the global pandemic and its impact on oil prices,” said
THIRD QUARTER 2020 CORPORATE HIGHLIGHTS
- In
September 2020 the Company successfully closed its convertible preferred share financing which provided net proceeds of$66.9 million , after all related transaction costs. The proceeds were used to immediately pay down existing bank debt and create additional available liquidity that will fund the Company’s development program; - Production averaged 13,701 boe/d (comprised of 31% condensate and 48% total liquids) for the three months ended
September 30, 2020 , despite an unplanned third-party processing facility outage at the Keyera Wapiti Plant which spanned 38 days fromAugust 17 th toSeptember 24 th; - As a result of modestly improved commodity pricing from Q2 2020, the Company generated revenue and adjusted funds flow of
$31.7 million and$6.4 million , respectively, during the three months endedSeptember 30, 2020 . Adjusted funds flow does not include any accrual for the business interruption insurance claim filed by the Company in relation to the 38-day unplanned outage at the Keyera Wapiti gas plant; and - During
September 2020 the Company re-started its drilling program with 2 wells drilled and rig-released from the 3-12 pad. In the first week ofOctober 2020 the Company rig-released 2 additional wells from the 3-12 pad that were in progress atSeptember 30, 2020 . Total drilling expenditures were$7.1 million for the quarter.
Pipestone
| Three months ended | Nine months ended | |||||||||||
| ($ thousands, except per unit and per share amounts) | 2020 | 2019 | 2020 | 2019 | ||||||||
| Financial | ||||||||||||
| Sales of liquids and natural gas | $ | 31,700 | $ | 7,808 | $ | 90,097 | $ | 13,725 | ||||
| Cash from (used in) operating activities | 660 | (6,626 | ) | 31,552 | (20,188 | ) | ||||||
| Adjusted funds flow from (used in) operations (1) | 6,359 | (2,734 | ) | 29,410 | (13,820 | ) | ||||||
| Per share, basic (2) | 0.03 | (0.01 | ) | 0.15 | (0.07 | ) | ||||||
| Loss | (11,486 | ) | (1,409 | ) | (15,431 | ) | (842 | ) | ||||
| Per share, basic and diluted (2) | (0.06 | ) | (0.01 | ) | (0.08 | ) | (0.00 | ) | ||||
| Capital expenditures | 11,806 | 29,434 | 60,853 | 125,737 | ||||||||
| Acquisitions | $ | - | $ | 98 | - | 214 | ||||||
| Working capital (deficit) surplus (end of period) | (25,478 | ) | 20,893 | |||||||||
| Bank debt (end of period) | 120,477 | 156,983 | ||||||||||
| Net debt (end of period) (1) | 136,411 | 144,326 | ||||||||||
| Shareholders’ equity (end of period) | 356,355 | 382,687 | ||||||||||
| Available funding (end of period) (1) | $ | 87,692 | $ | 32,655 | ||||||||
| Annualized cash return on invested capital (CROIC) (%) (1) | 6.2 | % | NMN (5) | 7.9 | % | NMN (5) | ||||||
| Annualized return on capital employed (ROCE) (%) (1) | (1.3 | %) | NMN (5) | 0.0 | % | NMN (5) | ||||||
| Shares outstanding (end of period) (2) | 190,572 | 189,627 | ||||||||||
| Weighted-average basic shares outstanding (2) | 190,468 | 189,627 | 190,150 | 187,949 | ||||||||
| Weighted-average diluted shares outstanding (2) | 190,468 | 189,627 | 190,150 | 187,949 | ||||||||
| Operations | ||||||||||||
| Production | ||||||||||||
| Crude oil (bbls/d) | 126 | 96 | 106 | 69 | ||||||||
| Condensate (bbls/d) | 4,265 | 1,016 | 4,334 | 531 | ||||||||
| Other natural gas liquids (NGL) (bbls/d) | 2,196 | 139 | 1,923 | 82 | ||||||||
| Total NGL (bbls/d) | 6,461 | 1,155 | 6,257 | 613 | ||||||||
| Natural gas (Mcf/d) | 42,683 | 7,298 | 50,876 | 4,011 | ||||||||
| Total (boe/d) (3) | 13,701 | 2,467 | 14,842 | 1,351 | ||||||||
| Condensate and crude oil (% of total production) | 32 | % | 45 | % | 30 | % | 44 | % | ||||
| Total liquids (% of total production) | 48 | % | 51 | % | 43 | % | 50 | % | ||||
| Benchmark prices | ||||||||||||
| Crude oil – WTI (C$/bbl) | $ | 54.48 | $ | 74.52 | $ | 51.39 | $ | 75.82 | ||||
| Condensate – Edmonton Condensate (C$/bbl) | 51.74 | 68.24 | 47.81 | 70.21 | ||||||||
| Natural gas – AECO 5A (C$/GJ) | 2.15 | 0.96 | 1.99 | 1.49 | ||||||||
| Average realized prices (4) | ||||||||||||
| Crude oil (per bbl) | 44.94 | 61.87 | 35.66 | 55.07 | ||||||||
| Condensate (per bbl) | 48.24 | 65.51 | 42.67 | 67.83 | ||||||||
| Other NGL (per bbl) | 16.41 | 12.57 | 14.57 | 19.47 | ||||||||
| Total NGL (per bbl) | 37.42 | 59.11 | 34.03 | 61.38 | ||||||||
| Natural gas (per Mcf) | 2.28 | 1.46 | 2.20- | 2.21 | ||||||||
| Netbacks | ||||||||||||
| Revenue (per boe) | 25.15 | 34.40 | 22.15 | 37.21 | ||||||||
| Royalties (per boe) | (0.87 | ) | (1.85 | ) | (0.53 | ) | (1.95 | ) | ||||
| Operating expenses (per boe) | (10.26 | ) | (15.29 | ) | (10.77 | ) | (15.27 | ) | ||||
| Transportation (per boe) | (3.80 | ) | (5.65 | ) | (3.57 | ) | (7.26 | ) | ||||
| Operating netback (per boe) (1) | 10.22 | 11.61 | 7.28 | 12.73 | ||||||||
| Adjusted funds flow netback (per boe) (1) | $ | 5.05 | $ | (12.04 | ) | $ | 7.23 | $ | (37.48 | ) | ||
| 1) | See “Advisories Regarding Non-GAAP Measures” section of the MD&A dated |
| 2) | The number of common shares has been adjusted retrospectively to reflect the 10:1 share consolidation, as well as the 0.5996 exchange ratio, as part of the Corporate Acquisition that closed on |
| 3) | For a description of the boe conversion ratio, see “Basis of Barrel of Oil Equivalent”. References to crude oil in production amounts are to the product type “tight oil” and references to natural gas in production amounts are to the product type “shale gas”. References to liquids include oil and natural gas liquids (including condensate, butane and propane). |
| 4) | Figures calculated before hedging. |
| 5) | NMN – not meaningful number at this time as |
| 6) | Prior period production and average realized price figures have been adjusted to conform with current period presentation. |
UPDATED THREE-YEAR DEVELOPMENT PLAN (1)
| 2021 Guidance | 2022 Forecast | 2023 Forecast | |||
| Full Year Production (boe/d) | 24,000 – 26,000 | 33,000 – 35,000 | 37,000 – 40,000 | ||
| Cash Flow (C$ million) (2)(3) | |||||
| Capex (C$ million) (4) | |||||
| Free Cash Flow(3) | ( | ||||
| YE Net Debt (C$ million) (3) | |||||
| YE RBL Draw (C$ million) | |||||
| LTM Debt / CF (x) | 1.6x | 0.8x | 0.5x | ||
| 1) | 3-year plan as at |
| 2) | Price assumptions: 2021 = |
| 3) | See “Advisories Regarding non-GAAP Measures”. Net debt excludes convertible preferred shares as there is no cash settled liability and includes adjusted working capital deficit. |
| 4) | Capex includes all anticipated DCE&T, infrastructure and other capital expenditures, but excludes capitalized G&A. |
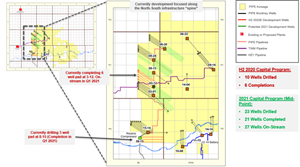
2021 Capital Program and Guidance
In 2021,
An estimated 27 new wells will be brought on production in 2021, including 6 wells from the in-progress 3-12 pad (completion in Q4 2020) and 3 wells from the 8-15 pad, which is currently drilling. Pipestone Energy’s production guidance range for 2021 remains unchanged at 24,000 – 26,000 boe/d. Given its concentrated asset base, existing multi-well pads, and in-field infrastructure,
OPERATIONS UPDATE
Drilling & Completions
During October, the Company began drilling the first of 3 wells on the 8-15 pad, which have an average lateral length of ~3,000 metres. These wells are expected to be completed in early
Production & Well Results
During the third quarter, average third-party plant run-times for the Company were adversely impacted by the extended 38-day outage at the Keyera Wapiti gas plant during August and September. Since resuming processing in the final week of September, the Keyera Wapiti gas plant runtime has been greater than 95%. In early October, the compression capacity at 8-15 was increased from 60 MMcf/d to 90 MMcf/d of raw gas in order to handle growing production volumes through 2021. Based on field estimates,
During Q3 2020,
ESG UPDATE
RISK MANAGEMENT UPDATE
Q3 2020 Conference Call
A conference call has been scheduled for
Conference Call Details:
Toll-Free: (866) 953-0776
International: (630) 652-5852
Conference ID: 4555285
An archived recording of the conference call will be available shortly after the event and will be available until
Pipestone Energy Contacts:
President and Chief Executive Officer (587) 392-8407 paul.wanklyn@pipestonecorp.com | Chief Financial Officer (587) 392-8408 craig.nieboer@pipestonecorp.com |
VP Corporate Development (587) 392-8414 dan.vankessel@pipestonecorp.com |
Advisory Regarding Non-GAAP Measures
Non-GAAP measures
This press release includes references to financial measures commonly used in the oil and natural gas industry. The terms “adjusted funds flow”, “cash flow”, “free cash flow, “operating netback”, “adjusted funds flow netback”, “net debt”, “available funding”, “CROIC”, and “ROCE” are not defined under IFRS, which have been incorporated into Canadian GAAP, as set out in Part 1 of the Chartered Professional Accountants Canada Handbook – Accounting, are not separately defined under GAAP, and may not be comparable with similar measures presented by other companies.
Management believes the presentation of the non-GAAP measures provide useful information to investors and shareholders as the measures provide increased transparency and the opportunity to better analyze and compare performance against prior periods.
Adjusted Funds Flow
Operating netback and Adjusted funds flow netback
Operating netback is calculated on a per-unit-of-production basis and is determined by deducting royalties, operating and transportation expenses from liquids and natural gas sales.
Adjusted funds flow netback reflects adjusted funds flow on a per-unit-of-production basis and is determined by dividing adjusted funds flow by total production on a per-boe basis. Adjusted funds flow netback can also be determined by deducting G&A, transaction costs, cash financing expenses, adding financing income and adjusting for realized gains/losses on financial derivative instruments on a per-unit-of-production basis from the operating netback.
Operating netback and adjusted funds flow netback are common metrics used in the oil and natural gas industry and are used by Company management to measure operating results on a per boe basis to better analyze and compare performance against prior periods, as well as formulate comparisons against peers.
Cash flow
“Cash flow” is a non-GAAP measure that is calculated as cash from operating activities plus changes in non-cash working capital and decommissioning provision costs incurred, and is not defined under IFRS. Cash flow should not be considered an alternative to, or more meaningful than, cash from operating activities, income (loss) or other measures determined in accordance with IFRS as an indicator of the Company’s performance. Management uses cash flow to analyze operating performance and leverage and believes it is a useful supplemental measure as it provides an indication of the funds generated by Pipestone Energy’s principal business activities prior to consideration of changes in working capital.
Free cash flow
“Free cash flow” is a non-GAAP measure that is calculated as cash from operating activities plus changes in non-cash working capital and decommissioning provision costs incurred, less capital expenditures incurred, and is not defined under IFRS. Free cash flow should not be considered an alternative to, or more meaningful than, cash from operating activities, income (loss) or other measures determined in accordance with IFRS as an indicator of the Company’s performance. Management uses free cash flow to analyze operating performance and leverage and believes it is a useful supplemental measure as it provides an indication of the funds generated by Pipestone Energy’s principal business activities, inclusive of ongoing capital expenditures, prior to consideration of changes in working capital.
Net debt
Net debt is a non-GAAP measure that equals bank debt outstanding plus adjusted working capital. The Company does not consider its convertible preferred share obligation to be part of net debt as this represents a non-cash obligation that will ultimately be settled by conversion into
Available funding and Adjusted working capital
Available funding is comprised of adjusted working capital and undrawn portions of the Company’s Credit Facility. Adjusted working capital is comprised of current assets less current liabilities on the Company’s consolidated statement of financial position and excludes the current portion of financial derivative instruments and lease liabilities. The available funding measure allows management and others to evaluate the Company’s short-term liquidity.
CROIC and ROCE
Adjusted EBITDA is calculated as profit or loss before interest, income taxes, depletion, depreciation and amortization, adjusted for certain non-cash and extraordinary items primarily relating to unrealized gains and losses on financial instruments. Adjusted EBITDA is used to calculate CROIC. Adjusted EBIT is calculated as adjusted EBITDA less depletion and depreciation. Adjusted EBIT is used to calculate ROCE.
CROIC is determined by dividing adjusted EBITDA by the gross carrying value of the Company’s oil and gas assets at a point in time. For the purposes of the CROIC calculation, the net carrying value of the Company’s exploration and evaluation assets, property and equipment and ROU assets, is taken from the Company’s consolidated statement of financial position, and excludes accumulated depletion and depreciation as disclosed in the financial statement notes to determine the gross carrying value.
ROCE is determined by dividing adjusted EBIT by the carrying value of the Company’s net assets. For the purposes for the ROCE calculation, net assets are defined as total assets on the Company’s consolidated statement of financial position less current liabilities at a point in time.
CROIC and ROCE allow management and others to evaluate the Company’s capital spending efficiency and ability to generate profitable returns by measuring profit or loss relative to the capital employed in the business.
Advisory Regarding Forward-Looking Statements
In the interest of providing shareholders of
Forward-looking statements are not promises of future outcomes. There is no assurance that the results or events indicated or suggested by the forward-looking statements, or the plans, intentions, expectations or beliefs contained therein or upon which they are based, are correct or will in fact occur or be realized (or if they do, what benefits
In particular, but without limiting the foregoing, this news release contains forward-looking statements pertaining to: growth of production volumes and cashflow; full cycle returns on invested capital; strategic plans and growth strategies; our expected development activity summary and three-year corporate growth trajectory, including expectations for number of wells to be drilled, completed and on production and three-year production growth, cash flow, capex, net debt, YE RBL draw, and LTM debt / cash flow; locations of wells to be developed; expectations to generate free cash flow and positive returns on capital; reduced outspend of cash flow and lower peak net debt, in addition to net debt reduction; total forecast capital spending for drilling program and the average DCE&T cost per well; expected completion and production date for 6 wells at Pipestone’s pad 3-12 and 3 wells at pad 8-15, with 27 wells being brought on production in 2021; on-stream dates for pads 3-12 and 8-15; production guidance range for 2021 to 2023; the optionality to accelerate development activity; completion and on-stream dates for pad 3-12; and the release of the Corporation’s ESG report.
With respect to the forward-looking statements contained in this news release,
The forward-looking statements contained herein reflect management's current views, but the assessments and assumptions upon which they are based may prove to be incorrect. Although
Certain information in this news release is “financial outlook” within the meaning of applicable securities laws. The purpose of this financial outlook is to provide readers with disclosure of the company’s reasonable expectations of our anticipate results. The financial outlook is provided as of the date of this news release. Readers are cautioned that this financial outlook may not be appropriate for other purposes.
The forward-looking statements contained in this news release are made as of the date hereof and
Initial Production Rates and Short-Term Test Rates
This document may disclose test rates of production for certain wells over short periods of time (i.e. IP30, IP90), which are preliminary and not determinative of the rates at which those or any other wells will commence production and thereafter decline. Short-term test rates are not necessarily indicative of long-term well or reservoir performance or of ultimate recovery. Although such rates are useful in confirming the presence of hydrocarbons, they are preliminary in nature, are subject to a high degree of predictive uncertainty as a result of limited data availability and may not be representative of stabilized on-stream production rates.
Production over a longer period will also experience natural decline rates, which can be high in the
Oil and Gas Measures
Basis of Barrel of Oil Equivalent
Petroleum and natural gas reserves and production volumes are stated as a “barrel of oil equivalent” (boe), derived by converting natural gas to oil equivalency in the ratio of 6,000 cubic feet of gas to one barrel of oil. Readers are cautioned that boe figures may be misleading, particularly if used in isolation. A boe conversion ratio of 6,000 cubic feet of gas to one barrel of oil is based on energy equivalency, which is primarily applicable at the burner tip, and does not represent a value equivalency at the wellhead.
DCE&T
This document contains certain other oil and gas metrics, including DCE&T (drilling, completion, equip and tie-in costs), which do not have standardized meanings or standard methods of calculation and therefore such measures may not be comparable to similar measures used by other companies and should not be used to make comparisons. Such metrics have been included herein to provide readers with additional measures to evaluate the Company's performance; however, such measures are not reliable indicators of the future performance and future performance may not compare to the performance in previous periods and therefore such metrics should not be unduly relied upon. DCE&T includes all capital spent to drill, complete, equip and tie-in a well.
CGR
References herein to “CGR” mean condensate/gas ratio and is expressed as a volume of condensate and NGLs (expressed in barrels) per million cubic feet (mmcf) of natural gas.
TSX Venture Exchange Disclaimer
Neither
A photo accompanying this announcement is available at https://www.globenewswire.com/NewsRoom/AttachmentNg/b1e86481-6323-472e-82a3-299b11e20eb6
![]()
2020 GlobeNewswire, Inc., source

