Company Announcement No. 028-2022 - Inside information
Financial Highlights H1 2022 - Historically high order intake and revenue, and strong rebound in profitability in Q2
- Order intake increased 25% to
DKK 143.7m in H1 2022 (H1 2021:DKK 114.6m ) -
Revenue increased 10% to
DKK 117.8m in H1 2022 (H1 2021:DKK 107.3m ) -
EBITDA increased 18% to
DKK 6.4 (H1 2021:DKK 5.5m ) corresponding to an EBITDA margin of 5.5% (H1 2021: 5.1%) -
The outlook for 2022 is maintained. Revenue is still expected to be in the range of
DKK 220-235m and EBITDA betweenDKK 13-18m . However, based on the developments in Q2, both revenue and EBITDA are now expected to be in the upper end of the guided ranges.
FINANCIAL
| DKKm | H1 2022 | H1 2021 | Change |
| Order intake | 143.7 | 114.6 | 25% |
| Revenue | 117.8 | 107.3 | 10% |
| Gross Profit | 48.6 | 45.6 | 6% |
| Gross Margin % | 41.3% | 42.6% | |
| EBITDA | 6.4 | 5.5 | 18% |
| EBITDA % | 5.5% | 5.1% | |
| Result after tax | -0.8 | -0.3 | |
| Net working capital | 29.0 | 21.3 | |
| Cash flow from operations | 2.7 | -8.5 | |
| NWC % of revenue (12 months running) | 12.3% | 9.9% | |
| Equity ratio % (net cash) | 26.1% | 32.3% |
MARKET ACTIVITY
In general, market activity is high and investments in intelligent natural ventilation solutions are on the rise - both for new buildings and integrated offerings for full indoor climate solutions, and for refurbishment of existing buildings.
Demand is driven by investments in energy efficient solutions and environmental regulation in both EU and US. In the EU, the demand is fueled by the EU's Green Deal and
the REPowerEU-plan. Building renovation is one of the most important and efficient solutions to address both climate change and reliance on fossil fuels.
In the US, the market for green technology is very attractive, and activity is high. Demand is likely to be further supported by
In general, global supply chain constraints have led to more ordering in advance to secure deliveries on time, which is enhancing visibility and allowing for more efficient planning of resources.
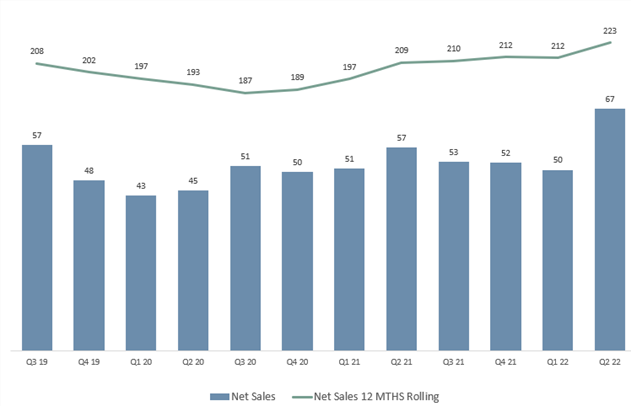
Order intake at the end of
Quarterly developments in order intake

BUSINESS MODEL
WindowMaster's business is split in three types of offerings.
The first area is Projects. This relates to integrated offerings of full indoor climate solutions, which typically include sale of products such as sensors, motors and controllers, sales of hours (project management, installation, and commissioning), programming, and various documentation. This offering is especially targeting building owners, contractors, façade builders and fenestration manufacturers. Increased scope and sale of integrated offerings are driving top line growth but have a slightly diluting impact on the gross margin. WindowMaster possesses comprehensive knowledge of integrating and controlling different building automation solutions (Solar Shading, Hybrid ventilation, Natural ventilation, Smoke and Heat ventilation, etc.) with the companies' control systems.
Based on the 32-year history of WindowMaster, many of the previously installed solutions are now ready to be refurbished and technological updated, and the target is to leverage the installed base for refurbishment jobs and service work. Refurbishments are driving both top-line growth and margin expansion.
The second area is Products. This includes recurring revenue from product sales to OEMs, distribution- and installation partners. The product portfolio within natural indoor climate solutions consists of a variety of specialty products such as controllers, motors, sensors, detectors, actuators, and accessories. The legacy Heat & Smoke business is increasingly converging with and becoming an integrated part of the natural ventilation solutions.
WindowMaster has built a scalable efficient production platform in
The third area is Service. Service contracts provide a stable and recurring revenue as well as increased customer satisfaction. Service contracts will typically include annual inspection as well as service and maintenance of moveable components and repair of minor errors and damages. Service contracts are driving both top-line growth and margin expansion.
With effect from
FINANCIAL DEVELOPMENTS H1 2022
Revenue
Revenue in H1 amounted to
Quarterly developments in Revenue
Gross profit
Gross profit amounted to
EBITDA
Operating profit (EBITDA) amounted to

The first quarter of the year was marked by high uncertainty and significant cost increases related to constraints in the global supply chain. However, the implementation of permanent price increases at the beginning of the year as well as temporary price supplements in the second quarter have mitigated the negative effects of cost increases incurred at the beginning of the year.
Cash flow and working capital
Cash flow from operating activities in H1 amounted to
At the end of H1, net working capital amounted to
Net working capital increased towards the end of 2021 and further in H1 due to a deliberate management decision to increase inventories and purchasing of strategically important electronic component on the spot market to be able to meet anticipated demand with competitive delivery times. No further increases in net working capital are anticipated in H2, and thus operating income is expected to flow through to free cash flow in H2.
Cash and financial position
Net interest-bearing debt at the end of H1 amounted to
Financial gearing calculated as NIBD/EBITDA amounted to 3.8 at the end of H1. (End of 2021: 3.6). The target is to be below 2.0.
At the end of H1, Equity amounted to
Risks
WindowMaster is exposed to market risks including currency risks, interest risks and commodity price risks as part of its ongoing operations and investment activities. As a supplier to the global construction industry, the company is also exposed to cyclical market developments and a potential economic slowdown.
The key commercial risks relate to the company's ability to effectively manage the anticipated growth. This involves attracting sufficient and skilled employees and safeguarding the level of competencies and market knowledge within the company. Additionally, the company is dependent on consistent and timely delivery of materials from suppliers to the assembly facility in
Outlook for 2022
The outlook for 2022 is maintained. Revenue is still expected to be in the range of
CONFERENCE CALL
WindowMaster invites investors to participate in a live video event on
FORWARD-LOOKING STATEMENTS
This announcement contains forward-looking statements. Words such as 'believe', 'expect', 'may', 'will', 'plan', 'strategy', 'prospect', 'foresee', 'estimate', 'project', 'anticipate', 'can', 'intend', 'outlook', 'guidance', 'target' and other words and terms of similar meaning in connection with any discussion of future operating or financial performance identify forward-looking statements. Statements regarding the future are subject to risks and uncertainties that may result in considerable deviations from the outlook set forth. Furthermore, some of these expectations are based on assumptions regarding future events which may prove incorrect.
FINANCIAL STATEMENTS JAN-
*Unaudited
| Financial highlights | |||||||||||||||||
| 2022-H1 DKK'000 | 2021-H1 DKK'000 | 2021-FY DKK'000 | |||||||||||||||
| Key figures | |||||||||||||||||
| Gross profit | 48.555 | 45.641 | 88.005 | ||||||||||||||
| EBITDA | 6.361 | 5.454 | 9.672 | ||||||||||||||
| Operating profit/loss | 934 | 509 | 646 | ||||||||||||||
| Net financials | -1.689 | -540 | -1.752 | ||||||||||||||
| Profit/loss for the year | -844 | -251 | -1.947 | ||||||||||||||
| Total assets | 175.345 | 124.202 | 147.197 | ||||||||||||||
| Investment in property, plant & equipment | 598 | 1.032 | 2.228 | ||||||||||||||
| Equity | 33.275 | 35.355 | 34.091 | ||||||||||||||
| Ratios | |||||||||||||||||
| Return of equity | -2,5% | -0,7% | -0,7% | ||||||||||||||
| Equity ratio | 19,0% | 28,5% | 23,2% | ||||||||||||||
| Equity ratio (net cash) | 26,1% | 32,3% | 28,4% | ||||||||||||||
| Financial highlights are defined and calculated in accordance with the current version of "Recommendations & Ratios" issued by the | |||||||||||||||||
| Ratios | Calculation formula | Calculation formula reflects | |||||||||||||||
| Return on equity % | Profit/loss of the year X 100 / Avg. equity | The entity's return on capital invested in the entity by the owners. | |||||||||||||||
| Equity ratio % | Equity X 100 / Total assets | The financial strength of the entity. | |||||||||||||||
| Equity ratio (net cash) % | In equity ratio (net cash), bank loans and cash have been netted out within the total assets amount. | ||||||||||||||||
Consolidated income statement for
| 2022- H1 | 2021- H1 | 2021-FY | ||||||||||
| DKK'000 | DKK'000 | DKK'000 | ||||||||||
| Net sales | 117,659 | 107,242 | 211,403 | |||||||||
| Gross profit | 48,555 | 45,641 | 88,005 | |||||||||
| Staff costs | -42,194 | -40,187 | -78,333 | |||||||||
| Depreciation, amortisation and impairment losses | -5,427 | -4,945 | -9,026 | |||||||||
| Operating profit/loss | 934 | 509 | 646 | |||||||||
| Other financial income | 1,202 | 679 | 1,205 | |||||||||
| Other financial expenses | -2.891 | -1,219 | -2,957 | |||||||||
| Profit/loss before tax | -755 | -31 | -1,106 | |||||||||
| Tax on profit/loss for the year | -89 | -220 | -841 | |||||||||
| Profit/loss for the year | -844 | -251 | -1,947 | |||||||||
Consolidated balance sheet as at
| Assets | 2022- H1 | 2021- H1 | 2021-FY | |||||||||
| DKK'000 | DKK'000 | DKK'000 | ||||||||||
| Acquired intangible assets | 11,019 | 8,326 | 11,367 | |||||||||
| Research and development projects | 10.457 | 8,297 | 10,141 | |||||||||
| 7,963 | 10,312 | 9,079 | ||||||||||
| Intangible assets | 29,439 | 26,935 | 30,587 | |||||||||
| Other fixtures and fittings, tools and equipment | 3,274 | 3,369 | 3,321 | |||||||||
| Leasehold improvements | 1,809 | 1,056 | 2,013 | |||||||||
| Property, plant and equipment | 5,083 | 4,425 | 5,334 | |||||||||
| Deposits | 989 | 800 | 985 | |||||||||
| Fixed assets investments | 989 | 800 | 985 | |||||||||
| Fixed assets | 35,511 | 32,160 | 36,906 | |||||||||
| Goods under production | 30,519 | 22,958 | 30,885 | |||||||||
| Manufactured goods and goods for resale | 11,007 | 8,577 | 13,416 | |||||||||
| Inventories | 41,526 | 31,535 | 44,301 | |||||||||
| Trade receivables | 32,042 | 25,726 | 22,254 | |||||||||
| Contract work in progress | 5,677 | 5,159 | 4,296 | |||||||||
| Receivables from group enterprises | 2,431 | 2,431 | 2,431 | |||||||||
| Deferred tax | 4,415 | 2,134 | 2,944 | |||||||||
| Other receivables | 706 | 5,557 | 4,305 | |||||||||
| Prepayments | 4,971 | 4,698 | 2,720 | |||||||||
| Receivables | 50,242 | 45,705 | 38,950 | |||||||||
| Cash | 48,066 | 14,802 | 27,040 | |||||||||
| Current assets | 139,834 | 92,042 | 110,291 | |||||||||
| Total assets | 175,345 | 124,202 | 147,197 | |||||||||
Liabilities | 2022- H1 | 2021- H1 | 2021-FY | |||||||||
| DKK'000 | DKK'000 | DKK'000 | ||||||||||
| Contributed capital | 14,513 | 14,513 | 14,513 | |||||||||
| Retained earnings | 18,762 | 20,842 | 19,578 | |||||||||
| Equity | 33,275 | 35,355 | 34,091 | |||||||||
| Deferred tax | 392 | 0 | 0 | |||||||||
| Other provisions | 982 | 1,058 | 982 | |||||||||
| Provisions | 1,374 | 1,058 | 982 | |||||||||
| Other payables | 3,469 | 3,522 | 3,797 | |||||||||
| Non-current liabilities other than provisions | 3,469 | 3,522 | 3,797 | |||||||||
| Current portion af long-term liabilities other than provisions | 358 | 313 | 720 | |||||||||
| Bank loans | 88,010 | 43,741 | 62.229 | |||||||||
| Contract work in progress | 0 | 3,773 | 4,247 | |||||||||
| Trade payables | 31,888 | 17,471 | 24,372 | |||||||||
| Income tax payables | 764 | 891 | 871 | |||||||||
| Other payables | 16,207 | 18,078 | 15,888 | |||||||||
| Current liabilities other than provisions | 137,227 | 84,267 | 108,327 | |||||||||
| Liabilities other than provisions | 140,696 | 87,789 | 112,124 | |||||||||
| Equity and liabilities | 175,345 | 124,202 | 147,197 | |||||||||
Consolidated statement of cash flows for
| 2022-H1 | 2021-H1 | 2021-FY | ||||||||||
| DKK'000 | DKK'000 | DKK'000 | ||||||||||
| Operating profit/loss | 934 | 509 | 646 | |||||||||
| Amortisation, depreciation and impairment losses | 5,427 | 4,945 | 9,026 | |||||||||
| Working capital changes | -3,660 | -11,358 | -12,139 | |||||||||
| Cash flow from ordinary operating activities | 2,701 | -5,904 | -2,467 | |||||||||
| Financial Income received | 1,202 | 679 | 1,205 | |||||||||
| Financial expenses paid | -2,891 | -1,219 | -2.957 | |||||||||
| Income taxes refunded/(paid) | -1.889 | -2,041 | -2,552 | |||||||||
| Cash flow from operating activities | -877 | -8,485 | -6,771 | |||||||||
| Acquisition etc of intangible assets | -3,352 | -13,249 | -20,141 | |||||||||
| Acquisition etc of property, plant and equipment | -598 | -1,032 | -2,228 | |||||||||
| Earn-out regarding purchase of subsidiaries | 0 | -9 | 0 | |||||||||
| Cash flows from investing activities | -3,950 | -14,290 | -22,369 | |||||||||
| Share issue | 0 | 1,386 | 1,500 | |||||||||
| Bank loans | 25,782 | 18,861 | 37,318 | |||||||||
| Cash flows from financing activities | 25.782 | 20,247 | 38,818 | |||||||||
| Increase/decrease in cash and cash equivalents | 20,955 | -2,528 | 9,678 | |||||||||
| Cash and cash equivalents beginning of period | 27,040 | 17,098 | 17,098 | |||||||||
| Exchange rate adjustments on cash and cash equivalents | 71 | 232 | 264 | |||||||||
| Cash and cash equivalents end of period | 48,066 | 14,802 | 27,040 | |||||||||
| Cash and cash equivalents at end of period are composed of: | ||||||||||||
| Cash | 48,066 | 14,802 | 27,040 | |||||||||
| Cash and cash equivalents end of period | 48.066 | 14,802 | 27,040 | |||||||||
MANAGEMENT'S STATEMENT
The Executive Management and Board of Directors of WindowMaster have today adopted the interim financial statement for the first six months of 2022. The Financial report has not been audited or reviewed by the Company's independent auditors.
The consolidated financial statements have been prepared in accordance with the Danish Financial Statements Act. In our opinion, the Interim Financial Statements give a true and fair view of the operations, financial position, and results, and describes the significant risks and uncertainties facing the company.
For further information:
CEO,
M: +45 4035 0267
Mail: ekb.dk@windowmaster.com
WindowMaster International A/S
Skelstedet 13
2950 Vedbæk
Certified Advisor
Direct(+45) 35 27 50 11, Mobile (+45) 31 79 90 00
Stockholmsgade 45
2100 Copenhagen Ø
About WindowMaster International A/S
WindowMaster is a Danish cleantech company originally founded in 1990 as part of the VELUX group, but changed ownership in a MBI in 2015. WindowMaster is both a market leader in the niche market for natural ventilation solutions as well as leading the technological advancements of cloud based IOT solutions in the field. This market position is based on a change of ownership in 2015 with the mission to provide green ventilation solutions to the construction industry and optimize indoor climate.
Today, buildings account for approx. 39% of global CO2 emissions, which drives demand for green solutions that can help reduce CO2 emissions from buildings worldwide. WindowMaster has built a strong and scalable platform to leverage the green wave of sustainability and contribute to greening the environmental footprint of various types of buildings - e.g. office buildings, sports arenas, hospitals, educational institutions, museums, etc. The company offers solutions that ensure optimal regulation of the indoor climate in buildings based on continuous monitoring of CO2 levels, humidity and temperature that can help increase efficiency and comfort of building users.
https://news.cision.com/windowmaster-international-a-s/r/windowmaster-releases-half-year-report-2022--historically-high-order-intake-and-revenue--and-strong-,c3615939
(c) 2022 Cision. All rights reserved., source
