Talking Points:
- Broken Trend Line Retest in NZD/CHF
- Key Resistance Zone for Selling the Pair
- Mixed Elliott Wave Signals to Consider First
US non-farm payroll (NFP) Fridays always tend to be days when many traders are afraid to take trades, but since this article is being written after the NFP announcement, that should not present so much of a problem. Currently, the daily chart of NZDCHF is showing an interesting formation, which may signify the end of a short recent trend.
Although this is one of the more common trades in trend line analysis, it is also a pattern that has been relatively rare in recent memory. Hopefully, this signals a shift away from the touch-and-go environment and sideways equity curve we’ve seen over the past two weeks. Although that comes with the territory, no trader would deny that it is among the most boring and sometimes most frustrating parts of trading.
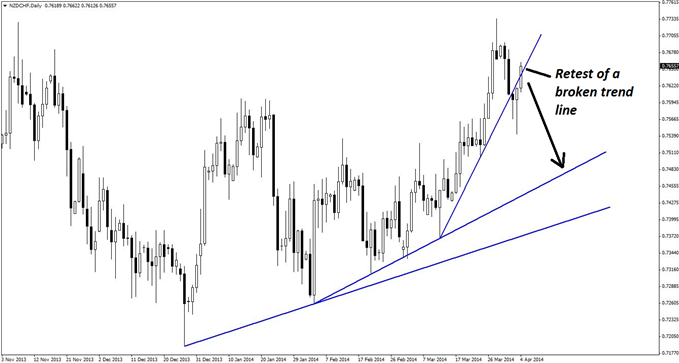
On the below chart, should a retest of the broken trend line materialize, the fall could contain nearly 200 pips of downside just to reach the next rising line of support.
Guest Commentary: Daily Trend Line Retest in NZD/CHF
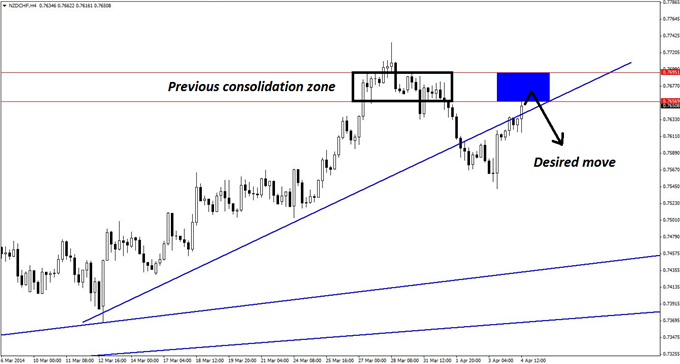
The four-hour chart below shows a handy resistance area derived from a previous consolidation. This resistance area is 0.7656-0.7695, a 39-pip zone that is somewhat small for a four-hour chart, but considering the possible for 200 pips to the downside, the overall risk profile is certainly inviting.
Guest Commentary: Key Zone for Selling NZD/CHF
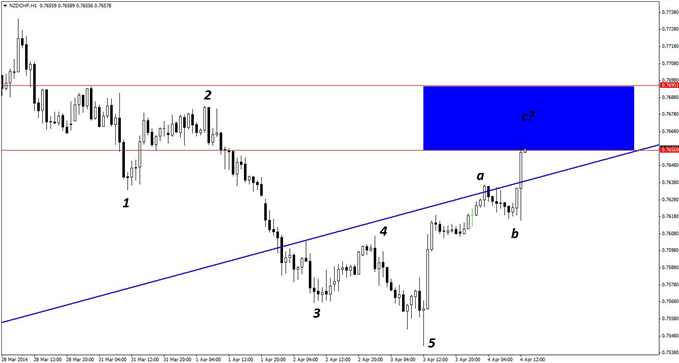
The best way to enter this trade would be on the hourly chart (see below) using bearish reversal divergence, pin bars, or bearish engulfing candlestick patterns as viable triggers. As we’ll see, however, Elliott wave purists may raise some questions about the validity of this set-up.
Guest Commentary: Mixed Elliott Wave Signals in NZD/CHF
Although countertrend trading is usually considered more dangerous, the daily chart has clearly broken a line of support, and thus, hypothesising a change in the trend to at least a sideways consolidation on the daily chart is perfectly reasonable. Regardless, though, two or three attempts may still be required to get in on this trade.
As marked on the hourly chart, there has been a five-wave decline, which lends greater credibility to the idea that a downtrend may have begun. The current retracement could well be an A-B-C formation, although Elliott purists would raise multiple objections, particularly with regard to the bullish momentum evidenced in the ‘a’ wave. This should not come as a surprise, however, as NZDCHF was originally in an uptrend.
Regardless of theory, common sense would suggest that there should be a surplus of bullish momentum to be washed out, and as such, an oversized retracement within the downtrend is perfectly acceptable.
By Kaye Lee, private fund trader and head trader consultant, StraightTalkTrading.com
original source


