E*TRADE Financial Corporation (NASDAQ: ETFC) today announced results from the most recent wave of StreetWise, the E*TRADE quarterly tracking study of experienced investors. Results show an increase in positive investor sentiment:
This press release features multimedia. View the full release here: https://www.businesswire.com/news/home/20190712005231/en/
Amid calls for a rate cut, many still think the economy remains healthy enough for a hike. (Graphic: Business Wire)
- Bullish sentiment crept higher. Bullishness rose three percentage points since last quarter to 61%, reaching a new high for 2019.
- Investors believe there’s still room for the bull market to run. Two-thirds (66%) of investors think the bull market has a year or more to go.
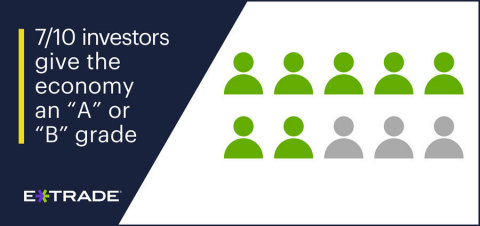
- More investors gave the US economy a passing grade. Investors who gave the economy an “A” or “B” grade rose five percentage points this quarter to 69%.
- And many think the economy can handle a Fed rate hike. Despite calls for a rate cut, more than two in five investors (43%) think the economy could handle another rate increase.
- Although they’re bracing for volatility. Investors believe volatility will remain at elevated levels, with over half (56%) thinking it will increase over the next quarter.
“Despite ongoing trade tensions and signs of economic softening, investors are staying focused on the positives,” said Mike Loewengart, VP of Investment Strategy at E*TRADE Financial. “While they still see a strong economy, at the same time they don’t seem complacent. In fact, volatility is top of mind. Based on this quarter’s survey, investors see potential opportunity in defensive plays to help ride out the volatility that may come their way.”
The survey explored investor views on sector opportunities for the third quarter of 2019:
- Health care. Health care remains the top choice among investors (48%) this quarter, as the sector is traditionally viewed as a defensive play amid global growth concerns.
- IT. Despite semiconductor weakness amid trade disputes and ongoing regulatory scrutiny, investors still see opportunities in the tech sector (47%), potentially taking advantage of historically depressed valuations.
- Energy. Energy remains a top choice, although interest ticked down seven percentage points from last quarter to 41%. With bond yields under pressure, income-focused investors could be turning to the sector as they hunt for potential dividend payers.
E*TRADE aims to enhance the financial independence of traders and investors through a powerful digital offering and professional guidance. To learn more about E*TRADE’s trading and investing platforms and tools, visit etrade.com.
For useful trading and investing insights from E*TRADE, follow the company on Twitter, @ETRADE.
About the Survey
This wave of the survey was conducted from July 1 to July 11 of 2019 among an online US sample of 908 self-directed active investors who manage at least $10,000 in an online brokerage account. The survey has a margin of error of ±3.20 percent at the 95 percent confidence level. It was fielded and administered by Dynata. The panel is broken into thirds of active (trade more than once a week), swing (trade less than once a week but more than once a month), and passive (trade less than once a month). The panel is 60% male and 40% female, with an even distribution across online brokerages, geographic regions, and age bands.
About E*TRADE Financial and Important Notices
E*TRADE Financial and its subsidiaries provide financial services including brokerage and banking products and services to retail customers. Securities products and services are offered by E*TRADE Securities LLC (Member FINRA/SIPC). Commodity futures and options on futures products and services are offered by E*TRADE Futures LLC (Member NFA). Managed Account Solutions are offered through E*TRADE Capital Management, LLC, a Registered Investment Adviser. Bank products and services are offered by E*TRADE Bank, and RIA custody solutions are offered by E*TRADE Savings Bank, both of which are national federal savings banks (Members FDIC). More information is available at www.etrade.com.
The information provided herein is for general informational purposes only and should not be considered investment advice. Past performance does not guarantee future results.
E*TRADE Financial, E*TRADE, and the E*TRADE logo are trademarks or registered trademarks of E*TRADE Financial Corporation. ETFC-G
© 2019 E*TRADE Financial Corporation. All rights reserved.
E*TRADE Financial Corporation engages Dynata to program, field, and tabulate the study. Dynata provides digital research data and has locations in the Americas, Europe, the Middle East and Asia-Pacific. For more information, please go to www.dynata.com.
Referenced Data
When it comes to the current market are you? | ||||
| Total | |||
| Q3’19 | Q2’19 | Q1’19 | Q1’18 |
Bullish | 61% | 58% | 46% | 68% |
Bearish | 39% | 42% | 54% | 32% |
How many years do you think we have left in the bull market? | ||
| Total | |
| Q3’19 | Q2’19 |
5+ years | 6% | 5% |
3–4 years | 20% | 24% |
1–2 years | 40% | 37% |
The end is near | 26% | 23% |
I don’t know | 8% | 11% |
What grade would you give the current state of the U.S. economy right now? | ||
| Total | |
| Q3’19 | Q2’19 |
A | 21% | 15% |
B | 48% | 49% |
C | 23% | 29% |
D | 5% | 5% |
F | 3% | 2% |
"The U.S. economy is healthy enough for the Fed to enact additional rate hikes this quarter." | ||
| Total | |
| Q3’19 | Q2’19 |
Strongly agree | 14% | 14% |
Somewhat agree | 29% | 27% |
Neither agree nor disagree | 31% | 28% |
Somewhat disagree | 19% | 24% |
Strongly agree | 7% | 7% |
Over the next quarter, do you think volatility will... | ||
| Total | |
| Q3’19 | Q2’19 |
Greatly increase | 12% | 9% |
Somewhat increase | 44% | 45% |
Stay the same | 40% | 41% |
Somewhat decrease | 4% | 5% |
Greatly decrease | 0% | 0% |
What industries do you think offer the most potential this quarter? (Top three) | |||||
| Q3’19 | Q2’19 | Q1’19 | Q4’18 | Q3’18 |
Health care | 48% | 48% | 50% | 44% | 41% |
Information technology | 47% | 44% | 38% | 49% | 45% |
Energy | 41% | 48% | 40% | 42% | 43% |
Financials | 35% | 34% | 36% | 40% | 41% |
Utilities | 26% | 27% | 29% | 23% | 24% |
Consumer staples | 25% | 22% | 30% | 21% | 19% |
Communication services | 23% | 22% | 23% | 21% | 27% |
Industrials | 21% | 22% | 20% | 21% | 22% |
Consumer discretionary | 18% | 15% | 17% | 22% | 19% |
Materials | 16% | 19% | 16% | 17% | 20% |
View source version on businesswire.com: https://www.businesswire.com/news/home/20190712005231/en/