FINANCIAL HIGHLIGHTS:
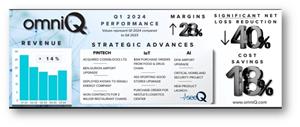
- Strong Revenue Growth: Our first quarter revenue increased by 14% to
$18.3M , compared to the last quarter of 2023. - Record Gross Margin: We achieved a record-high gross margin of 28% in Q1, a significant improvement from 21% in the same quarter last year and 13% in the last quarter of 2023.
- Improved Profitability: Our gross profit for the quarter soared by 142% from Q4 2023, reaching
$5.0 million . - Reduced Expenses: Selling, general, and administrative (SG&A) expenses were reduced by 18%, contributing to an overall 18% decrease in total operating expenses compared to Q1 of last year.
- Focusing on Profitability: Our operating loss decreased by 37%, from
$2 million in Q1 2023 to$1.3M in Q1 2024. Net loss also decreased by$1.4 million or 40% in the same period of 2023.
FIRST QUARTER 2024 FINANCIAL RESULTS
Our focus remains on growth and profitability. In the first quarter of 2024, our company demonstrated robust sales performance, with operations generating revenues of
Furthermore, the basic loss per share from continuing operations improved notably, reduced to (
These efforts not only demonstrate our commitment to operational excellence but also reflect our focus on enhancing shareholder value, evidenced by a 37% reduction in operational losses year-over-year.
ADDITIONAL Q1 AND RECENT EVENTS
Strategic Expansion in Airport and Security Operations:
- DFW Airport Upgrade: Continuing enhancements in our airport business with advanced AI-Machine Vision solution upgrade at
Dallas-Fort Worth International Airport . Homeland Security : Integrated AI-Machine Vision solutions purchased for a criticalhomeland security project.
Fintech Developments:
- Deployed self-service interactive consumer management kiosks at Israel’s largest energy company.
- Secured a contract with a major
U.S. -based restaurant chain for our self-ordering platform. - Implemented a new fintech solution at
Ben-Gurion Airport , improving traveler experience with self-ordering kiosks. - Won contract to supply proprietary fintech solutions to one of Israel’s largest fast food (QSR) chains.
Strong IoT Business:
- Secured over
$5 million in purchase orders from one of the largestU.S. food and drug chains andNestle International . - Upgrading systems across 450 sporting goods stores for a major
U.S. retailer.
Strategic Business Moves:
- New Product Launch: Introduced seeQ, our new product with capabilities that are currently purchased by AI machine-vision customers, with a strategic plan to expand to new markets. This is a SaaS product, creating an ongoing stream of revenue.
Acquired Codeblocks Ltd. , a leading fintech software developer, expanding our strategic capabilities in the fast-growing fintech market.
SHAREHOLDER UPDATE
As we navigate through a transformative period at
“We view the current situation as a temporary phase in our ongoing strategy focused on growth and profitability. We are actively executing our strategic plan and exploring every avenue to ensure a swift return to a national exchange listing. In the interim,
“Please be assured that
Next, we will discuss our Strategic plan for operational efficiency. Our management team is deeply committed to enhancing operational efficiency. We have implemented strategic measures aimed at reducing costs and increasing revenues. These initiatives are designed to streamline our operations and optimize our resource allocation, setting a robust path towards sustained profitability. This includes measures such as concentrating our sales efforts toward higher profit products, reducing operational costs without reducing operational efficiency, expanding product lines in large-growing markets, utilizing existing relationships and coming out with products that add value to those customers on a subscription basis, and more. This plan is showing results when looking at our Q1 financial numbers and we are expecting to see further improvements in Q2 and beyond until we regain profitability.
Now, we’ll talk about Fintech. The fintech market is experiencing rapid growth, driven by increasing demand for technology-driven financial solutions. This expansion presents significant opportunities for
Across the industries we operate in, trends such as digital transformation, AI integration, and automated solutions are influencing market dynamics. We are actively leveraging these trends to enhance our product offerings and stay ahead in competitive markets.
Finally, we are pleased to announce the appointment of a new board member,
“This quarter, omniQ has made significant strides towards financial stability. We've successfully streamlined operations and managed costs effectively, leading to a noticeable decrease in losses. Our focused efforts are not only improving our bottom line but also driving substantial growth in sales. This progress is a clear indicator of our commitment to operational excellence and value creation for our shareholders’” – CEO
ABOUT
Financially,
INFORMATION ABOUT FORWARD LOOKING STATEMENTS
“Safe Harbor” Statement under the Private Securities Litigation Reform Act of 1995. Statements in this press release relating to plans, strategies, economic performance and trends, projections of results of specific activities or investments, and other statements that are not descriptions of historical facts may be forward-looking statements within the meaning of the Private Securities Litigation Reform Act of 1995, Section 27A of the Securities Act of 1933 and Section 21E of the Securities Exchange Act of 1934.
This release contains “forward-looking statements” that include information relating to future events and future financial and operating performance. The words “anticipate,” “may,” “would,” “will,” “expect,” “estimate,” “can,” “believe,” “potential” and similar expressions and variations thereof are intended to identify forward-looking statements. Forward-looking statements should not be read as a guarantee of future performance or results and will not necessarily be accurate indications of the times at, or by, which that performance or those results will be achieved. Forward-looking statements are based on information available at the time they are made and/or management’s good faith belief as of that time with respect to future events and are subject to risks and uncertainties that could cause actual performance or results to differ materially from those expressed in or suggested by the forward-looking statements.
Examples of forward-looking statements include, among others, statements made in this press release regarding the closing of the private placement and the use of proceeds received in the private placement. Important factors that could cause these differences include, but are not limited to: fluctuations in demand for the Company’s products particularly during the current health crisis, the introduction of new products, the Company’s ability to maintain customer and strategic business relationships, the impact of competitive products and pricing, growth in targeted markets, the adequacy of the Company’s liquidity and financial strength to support its growth, the Company’s ability to manage credit and debt structures from vendors, debt holders and secured lenders, the Company’s ability to successfully integrate its acquisitions, and other information that may be detailed from time-to-time in OMNIQ Corp.’s filings with the
Contact
IR@omniq.com
CONDENSED CONSOLIDATED BALANCE SHEETS
| As of | ||||||||
| (In thousands, except share and per share data) | ||||||||
| (UNAUDITED) | ||||||||
| ASSETS | ||||||||
| Current assets | ||||||||
| Cash and cash equivalents | $ | 881 | $ | 1,678 | ||||
| Accounts receivable, net | 18,429 | 18,654 | ||||||
| Inventory | 5,676 | 6,028 | ||||||
| Prepaid expenses | 806 | 969 | ||||||
| Other current assets | 319 | 25 | ||||||
| Total current assets | 26,111 | 27,354 | ||||||
| Property and equipment, net of accumulated depreciation of | 981 | 1,066 | ||||||
| 2,891 | 1,788 | |||||||
| Trade name, net of accumulated amortization of | 1,312 | 1,377 | ||||||
| Customer relationships, net of accumulated amortization of | 3,575 | 3,777 | ||||||
| Other intangibles, net of accumulated amortization of | 478 | 504 | ||||||
| Right of use lease asset | 1,548 | 1,862 | ||||||
| Other assets | 1,965 | 1,758 | ||||||
| Total Assets | $ | 38,861 | $ | 39,486 | ||||
| LIABILITIES AND STOCKHOLDERS’ EQUITY | ||||||||
| Current liabilities | ||||||||
| Accounts payable and accrued liabilities | $ | 57,145 | $ | 56,741 | ||||
| Line of credit | 391 | 240 | ||||||
| Accrued payroll and sales tax | 2,311 | 1,537 | ||||||
| Notes payable – current portion | 9,451 | 10,196 | ||||||
| Lease liability – current portion | 758 | 885 | ||||||
| Other current liabilities | 2,430 | 3,106 | ||||||
| Total current liabilities | 72,486 | 72,705 | ||||||
| Long term liabilities | ||||||||
| Accrued interest and accrued liabilities, related party | 73 | 73 | ||||||
| Notes payable, less current portion | 1,392 | 265 | ||||||
| Lease liability | 820 | 1,011 | ||||||
| Other long-term liabilities | 619 | 452 | ||||||
| Total liabilities | 75,390 | 74,506 | ||||||
| Stockholders’ equity (deficit) | ||||||||
| Series A Preferred stock; | - | 0 | ||||||
| Series B Preferred stock; | - | 0 | ||||||
| Series C Preferred stock; | 1 | 1 | ||||||
| Common stock; | 11 | 11 | ||||||
| Additional paid-in capital | 78,639 | 78,340 | ||||||
| Accumulated (deficit) | (115,972 | ) | (113,923 | ) | ||||
| Accumulated other comprehensive income | 792 | 551 | ||||||
| Total | (36,529 | ) | (35,020 | ) | ||||
| Total liabilities and equity (deficit) | $ | 38,861 | $ | 39,486 | ||||
CONDENSED CONSOLIDATED STATEMENTS OF OPERATIONS AND COMPREHENSIVE LOSS
(UNAUDITED)
| For the Three months ended | ||||||||
| (In thousands, except share and per share data) | 2024 | 2023 | ||||||
| Revenues | $ | 18,317 | $ | 27,821 | ||||
| Cost of goods sold | 13,259 | 22,099 | ||||||
| Gross profit | 5,058 | 5,722 | ||||||
| Operating expenses | ||||||||
| Research & Development | 405 | 423 | ||||||
| Selling, general and administrative | 5,565 | 6,766 | ||||||
| Depreciation | 116 | 108 | ||||||
| Amortization | 231 | 436 | ||||||
| Total operating expenses | 6,317 | 7,733 | ||||||
| Loss from operations | (1,259 | ) | (2,011 | ) | ||||
| Other income (expenses): | ||||||||
| Interest expense | (917 | ) | (938 | ) | ||||
| Other (expenses) income | 31 | (751 | ) | |||||
| Total other expenses | (886 | ) | (1,689 | ) | ||||
| Net Loss Before Income Taxes | (2,145 | ) | (3,700 | ) | ||||
| Provision for Income Taxes | ||||||||
| Current | 47 | 193 | ||||||
| Total Provision for Income Taxes | 47 | 193 | ||||||
| Net Loss | $ | (2,098 | ) | $ | (3,507 | ) | ||
| Foreign currency translation adjustment | 241 | 457 | ||||||
| Comprehensive loss | $ | (1,857 | ) | $ | (3,050 | ) | ||
| Reconciliation of net loss to net loss attributable to common shareholders | ||||||||
| Net loss | $ | (2,098 | ) | $ | (3,507 | ) | ||
| Less: Dividends attributable to non-common stockholders’ of | (7 | ) | (8 | ) | ||||
| Net loss attributable to common stockholders’ of | $ | (2,105 | ) | $ | (3,515 | ) | ||
| Net (loss) per share - basic attributable to common stockholders’ of | $ | (0.20 | ) | $ | (0.45 | ) | ||
| Weighted average number of common shares outstanding - basic | 10,688,340 | 7,749,870 | ||||||
RECONCILIATION OF GAAP MEASURES TO NON-GAAP
MEASURES
| The three months ended | |||||||||
| (In thousands) | |||||||||
| Adjusted EBITDA Calculation | 2024 | 2023 | |||||||
| Net loss | (2,098 | ) | (3,507 | ) | |||||
| Depreciation & amortization | 347 | 544 | |||||||
| Interest expense | 917 | 938 | |||||||
| Income taxes | (47 | ) | (193 | ) | |||||
| Stock compensation | 517 | 516 | |||||||
| Nonrecurring loss events | (232 | ) | 1,036 | ||||||
| Adjusted EBITDA | (596 | ) | (666 | ) | |||||
| Total revenues, net | 18,317 | 27,821 | |||||||
| Adjusted EBITDA as a % of total revenues, net | (3.26 | %) | (2.39 | %) | |||||
Attachment
OMNIQ Corp.

![]()
OMNIQ Corp.
Q1 2024 PERFORMANCE
2024 GlobeNewswire, Inc., source


