California Resources Corporation (NYSE:CRC), an independent California-based oil and gas exploration and production company, today reported net income attributable to common stock (CRC net income) of $53 million or $1.22 per diluted share for the first quarter of 2017, compared with a loss of $50 million or $1.30 per diluted share for the same period of 2016.
This Smart News Release features multimedia. View the full release here: http://www.businesswire.com/news/home/20170504006423/en/
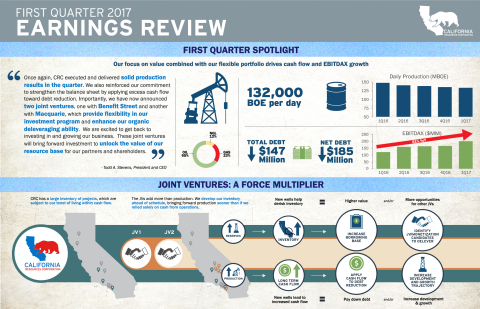
1Q17 Earnings Infographic (Graphic: Business Wire)
Adjusted EBITDAX1 for the first quarter of 2017 was $200 million, compared with $124 million for the first quarter of 2016. CRC reported operating cash flow of $133 million in the first quarter of 2017 and capital investments of $50 million.
Quarterly Highlights Include:
- Produced an average of 132,000 BOE per day
- Recognized a 38 percent year-over-year increase in realized per barrel crude oil prices, including effects of settled hedges
- Executed two joint ventures aggregating up to $550 million of incremental investment to accelerate development opportunities
- Reduced debt by $147 million from year-end 2016
- Generated operating cash flow of $133 million and free cash flow1 after working capital of $100 million
- Generated Adjusted EBITDAX of $200 million, reflecting an adjusted EBITDAX1 margin of 39%
Todd Stevens, President and Chief Executive Officer, said, "Once again, CRC executed and delivered solid production results in the quarter. We also reinforced our commitment to strengthen the balance sheet by applying excess cash flow toward debt reduction. Importantly, we have now announced two joint ventures, one with Benefit Street and another with Macquarie, which provide flexibility in our investment program and enhance our organic deleveraging ability. We are excited to get back to investing in and growing our business. These joint ventures will bring forward investment to unlock the value of our resource base for our partners and shareholders."
1 For explanations of how we calculate and use Adjusted EBITDAX (non-GAAP) and Adjusted EBITDAX margin and reconciliations of net income / (loss) (GAAP) and net cash provided by operating activities (GAAP) to Adjusted EBITDAX and free cash flow after working capital (non-GAAP), please see Attachments 2 and 3.
First Quarter Results
For the first quarter of 2017, CRC net income was $53 million or $1.22 per diluted share, compared with a loss of $50 million or $1.30 per diluted share for the same period of 2016. The 2017 quarterly results reflected higher realized oil, NGL, and natural gas prices, non-cash derivative gains, and gains from asset divestitures, partially offset by lower production volumes and higher production costs resulting from higher energy costs and higher levels of activity. The first quarter 2017 adjusted net loss2 was $43 million or $1.02 per diluted share, compared with an adjusted net loss of $100 million or $2.60 per diluted share for the same period of 2016. The first quarter 2017 adjusted net loss excluded $75 million of non-cash derivatives gains, a $21 million gain from asset divestitures, $4 million of gains on purchases of the Company's notes and a net $4 million loss from other unusual and infrequent charges. The first quarter 2016 adjusted net loss excluded $89 million of gains on purchases of the Company's notes, $81 million of non-cash derivatives losses, a $63 million benefit from a deferred tax valuation adjustment and a net $21 million loss from other unusual and infrequent charges.
Adjusted EBITDAX for the first quarter of 2017 was $200 million, compared to $124 million for the same period of 2016.
Total daily production volumes averaged 132,000 barrels of oil equivalent (BOE) for the first quarter of 2017, compared with 148,000 BOE for the first quarter of 2016, a decrease of under 11 percent, which is at the low end of CRC's estimated base production decline range. This decrease included the negative effects of production sharing contracts (PSC) of 2,000 BOE per day. Excluding this PSC effect, the year-over-year quarterly decline would have been 9 percent. Compared to the fourth quarter of 2016, total daily production volumes for the first quarter of 2017 decreased 3,000 BOE or 2 percent.
In the first quarter of 2017, realized crude oil prices, including the effect of settled hedges, increased $13.85 per barrel to $50.24 per barrel from $36.39 per barrel in the prior year comparable quarter. Settled hedges reduced realized crude oil prices by $0.16 per barrel in the first quarter of 2017, while increasing the first quarter 2016 realized price by $6.31 per barrel. Realized NGL prices increased 109 percent to $34.33 per barrel from $16.39 per barrel in the first quarter of 2016. Realized natural gas prices increased 41 percent to $2.90 per thousand cubic feet (Mcf), compared with $2.05 per Mcf in the same period of 2016.
Production costs for the first quarter of 2017 were $211 million or $17.70 per BOE, compared with $184 million or $13.69 per BOE for the first quarter of 2016. The increase in production costs was driven by higher natural gas prices and the ramp-up of downhole maintenance and workover activity in line with stronger commodity prices. While higher gas prices increase our production costs due to higher power and steam generation costs, they result in a net benefit to the Company as a result of higher revenue generated from natural gas sales. Our general and administrative (G&A) expenses were comparable to the same prior year period. Adjusted G&A expenses for the first quarter of 2017 were $64 million or $5.37 per BOE, compared with $53 million or $3.95 per BOE for the first quarter of 2016. The increase in the adjusted G&A expenses was a result of higher employee-related costs due to the resumption of employee benefits and higher costs of performance-based bonus and incentive compensation plans due to better than expected results.
Taxes other than on income of $33 million for the first quarter of 2017 were $6 million lower than the same period of 2016. Exploration expenses of $6 million for the first quarter of 2017 were comparable to the same period of 2016.
Capital investment in the first quarter of 2017 totaled $50 million, of which $34 million was directed to drilling and capital workovers.
2 For explanations of how we calculate and use Adjusted Net Loss (non-GAAP) and reconciliations to net income / (loss) (GAAP), please see Attachment 2.
Hedging Update
CRC will continue to opportunistically seek hedging transactions to protect its cash flow, margins and capital program and to maintain liquidity. See attachment 10 for more details.
Operational Update and 2017 Capital Investment Plan
CRC operated three rigs for most of the first quarter of 2017 with two in the San Joaquin basin and one in the Los Angeles basin. The Company added a fourth rig in the San Joaquin basin by quarter end. In the first quarter, CRC drilled thirteen steamflood wells, seven waterflood wells, five primary wells and three unconventional wells.
CRC has a dynamic capital plan which can be scaled up or down depending on the price environment. The third-party capital available as a result of the joint venture transactions further enhances the Company's optionality. Including the additional joint venture capital, CRC is increasing the 2017 capital plan to a range of $400 million to $425 million, consisting of up to $150 million for JV drilling and completions. The capital program will also include internally funded amounts of $120 million for CRC drilling and completions, $60 million for capital workovers, $50 million for facilities, $25 million primarily for mechanical integrity projects and $20 million for exploration. The 2017 development program will focus on the Company's core fields - Elk Hills, Wilmington, Kern Front, Buena Vista, Mt. Poso, Pleito Ranch, Wheeler Ridge and the delineation of Kettleman North Dome.
Conference Call Details
To participate in today’s conference call, either dial (877) 328-5505 (International calls please dial +1 (412) 317-5421) or access via webcast at www.crc.com, fifteen minutes prior to the scheduled start time to register. Participants may also pre-register for the conference call at http://dpregister.com/10104383. A digital replay of the conference call will be archived for approximately 30 days and supplemental slides for the conference call will be available online in Investor Relations at www.crc.com.
About California Resources Corporation
California Resources Corporation is the largest oil and natural gas exploration and production company in California on a gross-operated basis. The Company operates its world class resource base exclusively within the State of California, applying complementary and integrated infrastructure to gather, process and market its production. Using advanced technology, California Resources Corporation focuses on safely and responsibly supplying affordable energy for California by Californians.
Forward-Looking Statements
This presentation contains forward-looking statements that involve risks and uncertainties that could materially affect our expected results of operations, liquidity, cash flows and business prospects. Such statements include those regarding our expectations as to our future:
- financial position, liquidity, cash flows and results of operations
- business prospects
- transactions and projects
- operating costs
- operations and operational results including production, hedging, capital investment and expected VCI
- budgets and maintenance capital requirements
- reserves
Actual results may differ from anticipated results, sometimes materially, and reported results should not be considered an indication of future performance. While we believe assumptions or bases underlying our expectations are reasonable and make them in good faith, they almost always vary from actual results, sometimes materially. Factors (but not necessarily all the factors) that could cause results to differ include:
- commodity price changes
- debt limitations on our financial flexibility
- insufficient cash flow to fund planned investment
- inability to enter desirable transactions including asset sales and joint ventures
- legislative or regulatory changes, including those related to drilling, completion, well stimulation, operation, maintenance or abandonment of wells or facilities, managing energy, water, land, greenhouse gases or other emissions, protection of health, safety and the environment, or transportation, marketing and sale of our products
- unexpected geologic conditions
- changes in business strategy
- inability to replace reserves
- insufficient capital, including as a result of lender restrictions, unavailability of capital markets or inability to attract potential investors
- inability to enter efficient hedges
- equipment, service or labor price inflation or unavailability
- availability or timing of, or conditions imposed on, permits and approvals
- lower-than-expected production, reserves or resources from development projects or acquisitions or higher-than-expected decline rates
- disruptions due to accidents, mechanical failures, transportation constraints, natural disasters, labor difficulties, cyber attacks or other catastrophic events
- factors discussed in “Risk Factors” in our Annual Report on Form 10-K available on our website at crc.com.
Words such as "anticipate," "believe," "continue," "could," "estimate," "expect," "goal," "intend," "likely," "may," "might," "plan," "potential," "project," "seek," "should," "target, "will" or "would" and similar words that reflect the prospective nature of events or outcomes typically identify forward-looking statements. Any forward-looking statement speaks only as of the date on which such statement is made and the Company undertakes no obligation to correct or update any forward-looking statement, whether as a result of new information, future events or otherwise, except as required by applicable law.
| Attachment 1 | |||||||||
SUMMARY OF RESULTS | |||||||||
| First Quarter | |||||||||
| ($ and shares in millions, except per share amounts) | 2017 | 2016 | |||||||
Statement of Operations Data: | |||||||||
| Revenues and Other | |||||||||
| Oil and gas net sales | $ | 487 | $ | 329 | |||||
| Net derivative gains (losses) | 73 | (25 | ) | ||||||
| Other revenue | 30 | 18 | |||||||
| Total revenues and other | 590 | 322 | |||||||
| Costs and Other | |||||||||
| Production costs | 211 | 184 | |||||||
| General and administrative expenses | 67 | 67 | |||||||
| Depreciation, depletion and amortization | 140 | 147 | |||||||
| Taxes other than on income | 33 | 39 | |||||||
| Exploration expense | 6 | 5 | |||||||
| Other expenses, net | 22 | 23 | |||||||
| Total costs and other | 479 | 465 | |||||||
| Operating Income (Loss) | 111 | (143 | ) | ||||||
| Non-Operating Income (Loss) | |||||||||
| Interest and debt expense, net | (84 | ) | (74 | ) | |||||
| Net gains on early extinguishment of debt | 4 | 89 | |||||||
| Gains on asset divestitures | 21 | — | |||||||
| Income (Loss) Before Income Taxes | 52 | (128 | ) | ||||||
| Income tax benefit | — | 78 | |||||||
| Net Income (Loss) | 52 | (50 | ) | ||||||
| Net (income) loss attributable to noncontrolling interest | 1 | — | |||||||
| Net Income (Loss) Attributable to Common Stock | $ | 53 | $ | (50 | ) | ||||
| Earnings (loss) per share (EPS) of common stock - diluted | $ | 1.22 | $ | (1.30 | ) | ||||
| Adjusted Net Loss | $ | (43 | ) | $ | (100 | ) | |||
| Adjusted EPS - diluted | $ | (1.02 | ) | $ | (2.60 | ) | |||
| Weighted-average common shares outstanding - diluted | 42.6 | 38.5 | |||||||
| Adjusted EBITDAX | $ | 200 | $ | 124 | |||||
| Effective tax rate | 0 | % | 61 | % | |||||
Cash Flow Data: | |||||||||
| Net cash provided by operating activities | $ | 133 | $ | 115 | |||||
| Net cash used by investing activities | $ | — | $ | (29 | ) | ||||
| Net cash used by financing activities | $ | (95 | ) | $ | (88 | ) | |||
Balance Sheet Data: | March 31, | December 31, | |||||||
| 2017 | 2016 | ||||||||
| Total current assets | $ | 409 | $ | 425 | |||||
| Property, plant and equipment, net | $ | 5,793 | $ | 5,885 | |||||
| Current maturities of long-term debt | $ | 100 | $ | 100 | |||||
| Other current liabilities | $ | 588 | $ | 626 | |||||
| Long-term debt, principal amount | $ | 5,021 | $ | 5,168 | |||||
| Total equity | $ | (447 | ) | $ | (557 | ) | |||
| Outstanding shares as of | 42.6 | 42.5 | |||||||
| Attachment 2 | ||||||||
| NON-GAAP FINANCIAL MEASURES AND RECONCILIATIONS | ||||||||
| Our results of operations can include the effects of unusual and infrequent transactions and events affecting earnings that vary widely and unpredictably in nature, timing, amount and frequency. Therefore, management uses a measure called "adjusted net income / (loss)" and a measure it calls "adjusted general and administrative expenses" which exclude those items. These non-GAAP measures are not meant to disassociate items from management's performance, but rather are meant to provide useful information to investors interested in comparing our performance between periods. Reported earnings are considered representative of management's performance over the long term. Adjusted net income / (loss) and adjusted general and administrative expenses are not considered to be alternatives to net income / (loss) and general and administrative expenses reported in accordance with U.S. generally accepted accounting principles (GAAP). | ||||||||
| The following table presents a reconciliation of the GAAP financial measure of net income (loss) attributable to common stock to the non-GAAP financial measure of adjusted net (loss) income: | ||||||||
| First Quarter | ||||||||
| ($ millions, except per share amounts) | 2017 | 2016 | ||||||
| Net income (loss) attributable to common stock | $ | 53 | $ | (50 | ) | |||
| Unusual and infrequent items: | ||||||||
| Non-cash derivative (gains) losses | (75 | ) | 81 | |||||
| Early retirement, severance and other costs | 3 | 14 | ||||||
| Gains from asset divestitures | (21 | ) | — | |||||
| Net gains on early extinguishment of debt | (4 | ) | (89 | ) | ||||
| Other | 1 | 7 | ||||||
| Adjusted income items before taxes | (96 | ) | 13 | |||||
| Reversal of valuation allowance for deferred tax assets (a) | — | (63 | ) | |||||
| Total | $ | (96 | ) | $ | (50 | ) | ||
| Adjusted net loss | $ | (43 | ) | $ | (100 | ) | ||
| Net income (loss) attributable to common stock per diluted share | $ | 1.22 | $ | (1.30 | ) | |||
| Adjusted net loss per diluted share | $ | (1.02 | ) | $ | (2.60 | ) | ||
| (a) Amount represents the out-of-period portion of the valuation allowance reversal. | ||||||||
| DERIVATIVES GAINS AND LOSSES | ||||||||
| First Quarter | ||||||||
| ($ millions) | 2017 | 2016 | ||||||
| Non-cash derivative (gains) losses | $ | (75 | ) | $ | 81 | |||
| Non-cash derivative losses for noncontrolling interest | 1 | — | ||||||
| Cash payments (proceeds) from settled derivatives | 1 | (56 | ) | |||||
| Net derivative (gains) losses | $ | (73 | ) | $ | 25 | |||
| FREE CASH FLOW | ||||||||
| First Quarter | ||||||||
| ($ millions) | 2017 | 2016 | ||||||
| Operating cash flow | $ | 133 | $ | 115 | ||||
| Capital investment | (50 | ) | (21 | ) | ||||
| Changes in capital accruals | 17 | (7 | ) | |||||
| Free cash flow (after working capital) | $ | 100 | $ | 87 | ||||
| ADJUSTED GENERAL AND ADMINISTRATIVE EXPENSES | ||||||||
| First Quarter | ||||||||
| ($ millions) | 2017 | 2016 | ||||||
| General and administrative expenses | $ | 67 | $ | 67 | ||||
| Early retirement and severance costs | (3 | ) | (14 | ) | ||||
| Adjusted general and administrative expenses | $ | 64 | $ | 53 | ||||
| Attachment 3 | ||||||||
| NON-GAAP FINANCIAL MEASURES AND RECONCILIATIONS | ||||||||
| We define adjusted EBITDAX as earnings before interest expense; income taxes; depreciation, depletion and amortization; exploration expense; and other unusual and infrequent items. Our management believes adjusted EBITDAX provides useful information in assessing our financial condition, results of operations and cash flows and is widely used by the industry, the investment community and our lenders. While adjusted EBITDAX is a non-GAAP measure, the amounts included in the calculation of adjusted EBITDAX were computed in accordance with GAAP. This measure is a material component of certain of our financial covenants under our first-lien, first-out credit facilities and is provided in addition to, and not as an alternative for, income and liquidity measures calculated in accordance with GAAP. Certain items excluded from adjusted EBITDAX are significant components in understanding and assessing our financial performance, such as our cost of capital and tax structure, as well as the historic cost of depreciable and depletable assets. Adjusted EBITDAX should be read in conjunction with the information contained in our financial statements prepared in accordance with GAAP. | ||||||||
| The following tables present a reconciliation of the GAAP financial measures of net income / (loss) attributable to common stock and net cash provided / (used) by operating activities to the non-GAAP financial measure of adjusted EBITDAX: | ||||||||
| First Quarter | ||||||||
| ($ millions) | 2017 | 2016 | ||||||
| Net income (loss) attributable to common stock | $ | 53 | $ | (50 | ) | |||
| Interest and debt expense, net | 84 | 74 | ||||||
| Income tax benefit | — | (78 | ) | |||||
| Depreciation, depletion and amortization | 140 | 147 | ||||||
| Exploration expense | 6 | 5 | ||||||
| Adjusted income items before taxes(a) | (96 | ) | 13 | |||||
| Other non-cash items | 13 | 13 | ||||||
| Adjusted EBITDAX (A) | $ | 200 | $ | 124 | ||||
| Net cash provided by operating activities | $ | 133 | $ | 115 | ||||
| Cash interest | 44 | 48 | ||||||
| Exploration expenditures | 5 | 5 | ||||||
| Other changes in operating assets and liabilities | 17 | (51 | ) | |||||
| Other | 1 | 7 | ||||||
| Adjusted EBITDAX (A) | $ | 200 | $ | 124 | ||||
| (a) See Attachment 2. | ||||||||
| ADJUSTED EBITDAX MARGIN | ||||||||
| First Quarter | ||||||||
| ($ millions) | 2017 | 2016 | ||||||
| Total Revenues | $ | 590 | $ | 322 | ||||
| Non-cash derivative (gains) losses(b) | (75 | ) | 81 | |||||
| Adjusted revenues (B) | $ | 515 | $ | 403 | ||||
| Adjusted EBITDAX Margin (A)/(B) | 39 | % | 31 | % | ||||
| (b) Excluding noncontrolling interest. | ||||||||
| Attachment 4 | ||||
| ADJUSTED NET INCOME / (LOSS) VARIANCE ANALYSIS | ||||
| ($ millions) | ||||
| 2016 1st Quarter Adjusted Net Loss | $ | (100 | ) | |
| Price - Oil | 123 | |||
| Price - NGLs | 28 | |||
| Price - Natural Gas | 15 | |||
| Volume | (40 | ) | ||
| Production cost rate | (35 | ) | ||
| DD&A rate | (9 | ) | ||
| Exploration expense | (1 | ) | ||
| Interest expense | (10 | ) | ||
| Adjusted general & administrative expenses | (11 | ) | ||
| Income tax | (15 | ) | ||
| All Others | 12 | |||
| 2017 1st Quarter Adjusted Net Loss | $ | (43 | ) | |
| Attachment 5 | |||||||
| CAPITAL INVESTMENTS | |||||||
| First Quarter | |||||||
| ($ millions) | 2017 | 2016 | |||||
| Capital Investments: | |||||||
| Conventional | $ | 25 | $ | 1 | |||
| Unconventional | 24 | 1 | |||||
| Other (a) | 1 | 19 | |||||
| $ | 50 | $ | 21 | ||||
| (a) 1st quarter of 2016 includes $19 million of capital incurred for the turnaround at the Elk Hills Power Plant. | |||||||
| Attachment 6 | ||||||||||
| PRODUCTION STATISTICS | ||||||||||
| First Quarter | ||||||||||
| Net Oil, NGLs and Natural Gas Production Per Day | 2017 | 2016 | ||||||||
| Oil (MBbl/d) | ||||||||||
| San Joaquin Basin | 54 | 60 | ||||||||
| Los Angeles Basin | 27 | 32 | ||||||||
| Ventura Basin | 5 | 6 | ||||||||
| Sacramento Basin | — | — | ||||||||
| Total | 86 | 98 | ||||||||
| NGLs (MBbl/d) | ||||||||||
| San Joaquin Basin | 15 | 16 | ||||||||
| Los Angeles Basin | — | — | ||||||||
| Ventura Basin | 1 | 1 | ||||||||
| Sacramento Basin | — | — | ||||||||
| Total | 16 | 17 | ||||||||
| Natural Gas (MMcf/d) | ||||||||||
| San Joaquin Basin | 141 | 147 | ||||||||
| Los Angeles Basin | 1 | 3 | ||||||||
| Ventura Basin | 8 | 8 | ||||||||
| Sacramento Basin | 31 | 38 | ||||||||
| Total | 181 | 196 | ||||||||
| Total Production (MBoe/d) (a) | 132 | 148 | ||||||||
| (a) Natural gas volumes have been converted to BOE based on the equivalence of energy content between six Mcf of natural gas and one Bbl of oil. Barrels of oil equivalence does not necessarily result in price equivalence. The price of natural gas on a BOE basis is currently substantially lower than the corresponding price for oil and has been similarly lower for a number of years. For example, for in the first quarter of 2017, the average prices of Brent oil and NYMEX natural gas were $54.66 per Bbl and $3.26 per MMBtu, respectively, resulting in an oil-to-gas price ratio of approximately 17 to 1. | ||||||||||
| Attachment 7 | ||||||||||||
| PRICE STATISTICS | ||||||||||||
| First Quarter | ||||||||||||
| 2017 | 2016 | |||||||||||
| Realized Prices | ||||||||||||
| Oil with hedge ($/Bbl) | $ | 50.24 | $ | 36.39 | ||||||||
| Oil without hedge ($/Bbl) | $ | 50.40 | $ | 30.08 | ||||||||
| NGLs ($/Bbl) | $ | 34.33 | $ | 16.39 | ||||||||
| Natural gas without hedge ($/Mcf) | $ | 2.90 | $ | 2.05 | ||||||||
| Index Prices | ||||||||||||
| Brent oil ($/Bbl) | $ | 54.66 | $ | 35.08 | ||||||||
| WTI oil ($/Bbl) | $ | 51.91 | $ | 33.45 | ||||||||
| NYMEX gas ($/MMBtu) | $ | 3.26 | $ | 2.07 | ||||||||
| Realized Prices as Percentage of Index Prices | ||||||||||||
| Oil with hedge as a percentage of Brent | 92 | % | 104 | % | ||||||||
| Oil without hedge as a percentage of Brent | 92 | % | 86 | % | ||||||||
| Oil with hedge as a percentage of WTI | 97 | % | 109 | % | ||||||||
| Oil without hedge as a percentage of WTI | 97 | % | 90 | % | ||||||||
| NGLs as a percentage of Brent | 63 | % | 47 | % | ||||||||
| NGLs as a percentage of WTI | 66 | % | 49 | % | ||||||||
| Natural gas without hedge as a percentage of NYMEX | 89 | % | 99 | % | ||||||||
| Attachment 8 | ||||
| 2017 SECOND QUARTER GUIDANCE | ||||
| Anticipated Realizations Against the Prevailing Index Prices for Q2 2017 (a) | ||||
| Oil | 88% to 92% of Brent | |||
| NGLs | 53% to 57% of Brent | |||
| Natural Gas | 78% to 82% of NYMEX | |||
| 2017 Second Quarter Production, Capital and Income Statement Guidance | ||||
| Production (without JV) | 127 to 132 MBOE per day | |||
| Production (with JV) | 128 to 133 MBOE per day | |||
| Capital (without JV) | $80 million to $100 million | |||
| Capital (with JV) | $85 million to $105 million | |||
| Production costs | $18.05 to $18.55 per BOE | |||
| Adjusted general and administrative expenses | $5.40 to $5.70 per BOE | |||
| Depreciation, depletion and amortization | $11.65 to $11.95 per BOE | |||
| Taxes other than on income | $30 million to $34 million | |||
| Exploration expense | $3 million to $7 million | |||
| Interest expense (b) | $81 million to $85 million | |||
| Cash Interest (b) | $149 million to $153 million | |||
| Income tax expense rate | 0% | |||
| Cash tax rate | 0% | |||
| On Income | On Cash | |||
| Pre-tax Second Quarter Price Sensitivities | ||||
| $1 change in Brent index - Oil (at above $55.00 Brent) (c) | $4.2 million | $4.2 million | ||
| $1 change in Brent index - NGLs | $0.7 million | $0.7 million | ||
| $0.50 change in NYMEX - Gas | $1.5 million | $1.5 million | ||
| Second Quarter Volumes Sensitivities | ||||
| $1 change in the Brent index (d) | 200 Bbl/d | |||
| (a) Realizations exclude hedge effects. | ||||
| (b) Interest expense includes the amortization of the deferred gain that resulted from the December 2015 debt exchange. Cash interest for the quarter is lower than interest expense due to the timing of interest payments. | ||||
| (c) At a Brent index price between $50.00 and $55.00 the sensitivity goes up to $4.6 million. Below $50.00 Brent, the sensitivity drops to about $3.0 million. | ||||
| (d) Reflects the effect of production sharing type contracts in our Wilmington field operations. | ||||
| Attachment 9 | |||||||||||||||
| FIRST QUARTER DRILLING ACTIVITY | |||||||||||||||
| San Joaquin | Los Angeles | Ventura | Sacramento | ||||||||||||
| Wells Drilled (Net) | Basin | Basin | Basin | Basin | Total | ||||||||||
| Development Wells | |||||||||||||||
| Primary | 5 | — | — | — | 5 | ||||||||||
| Waterflood | 4 | 3 | — | — | 7 | ||||||||||
| Steamflood | 13 | — | — | — | 13 | ||||||||||
| Unconventional | 3 | — | — | — | 3 | ||||||||||
| Total | 25 | 3 | — | — | 28 | ||||||||||
| Exploration Wells | |||||||||||||||
| Primary | — | — | — | — | — | ||||||||||
| Waterflood | — | — | — | — | — | ||||||||||
| Steamflood | — | — | — | — | — | ||||||||||
| Unconventional | — | — | — | — | — | ||||||||||
| Total | — | — | — | — | — | ||||||||||
| Total Wells | 25 | 3 | — | — | 28 | ||||||||||
| Development Drilling Capital ($ millions) | $ | 14 | $ | 6 | $ | — | $ | — | $ | 20 | |||||
| Attachment 10 | ||||||||||||||
| HEDGING ACTIVITY - CURRENT | ||||||||||||||
| 2Q | 3Q | 4Q | 1Q | 2Q - 4Q | FY | FY | ||||||||
| 2017 | 2017 | 2017 | 2018 | 2018 | 2019 | 2020 | ||||||||
| Crude Oil | ||||||||||||||
| Calls: | ||||||||||||||
| Barrels per day | 5,600 | 5,600 | 10,600 | 16,200 | 15,500 | 500 | 400 | |||||||
| Weighted-average price per barrel | $55.60 | $57.54 | $56.83 | $58.81 | $58.87 | $60.00 | $60.00 | |||||||
| Puts: | ||||||||||||||
| Barrels per day | 20,600 | 17,600 | 10,600 | 600 | 500 | 500 | 400 | |||||||
| Weighted-average price per barrel | $50.24 | $50.85 | $48.11 | $50.00 | $50.00 | $50.00 | $50.00 | |||||||
| Swaps: | ||||||||||||||
| Barrels per day | 20,000 | 25,000 | 25,000 | — | — | — | — | |||||||
| Weighted-average price per barrel | $53.98 | $54.99 | $54.99 | $— | $— | $— | $— | |||||||
| A small portion of these derivatives are attributable to BSP's noncontrolling interest, including all the 2019 and 2020 positions. Some of the third and fourth quarter 2017 crude oil swaps grant our counterparties quarterly options to increase volumes by up to 10,000 barrels per day for each quarter at a weighted-average Brent price of $55.46. Our counterparties also have options to further increase volumes by up to 10,000 barrels per day for the second half of 2017 at a weighted-average Brent price of $60.24. | ||||||||||||||
View source version on businesswire.com: http://www.businesswire.com/news/home/20170504006423/en/
