Talking Points:
- Weekly Pennant Formation for EUR/CHF
- Clear Confirmation from the Daily Chart
- How to Secure Risk of Only 8-12 Pips
It is rather rare for intraday traders to have an opportunity to participate in moves involving the weekly chart, but such a set-up may be present in EURCHF right now.
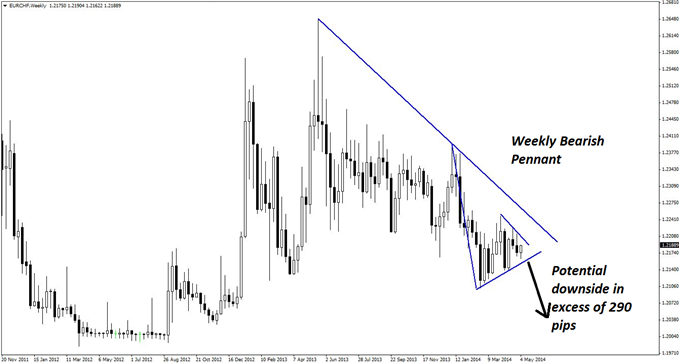
As shown below, the pair has formed a bearish pennant pattern, and although price has not yet broken the pennant, a breakout to the downside could (according to classical technical analysis) give rise to a move of 290 pips or more in that direction, and with minuscule risk to boot.
Guest Commentary: Bearish Pennant on EUR/CHF Weekly Chart
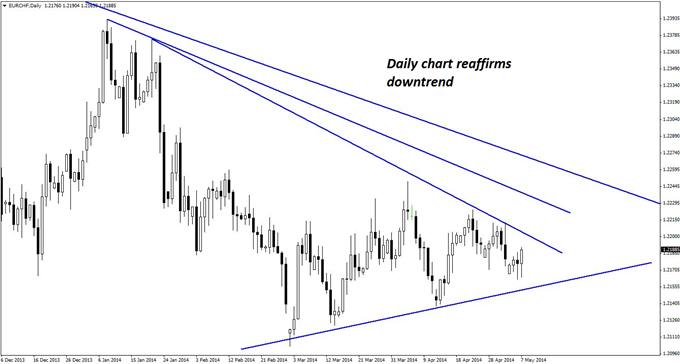
The daily pattern (see below) reaffirms the downtrend. Clearly, EURCHF has been retracing back up toward the declining lines of resistance, as it has paused for a breath following a major move down early this year. Price has already begun to flirt with one of the declining trend lines, and may soon continue its descent.
Guest Commentary: Clear Confirmation on EUR/CHF Daily Chart
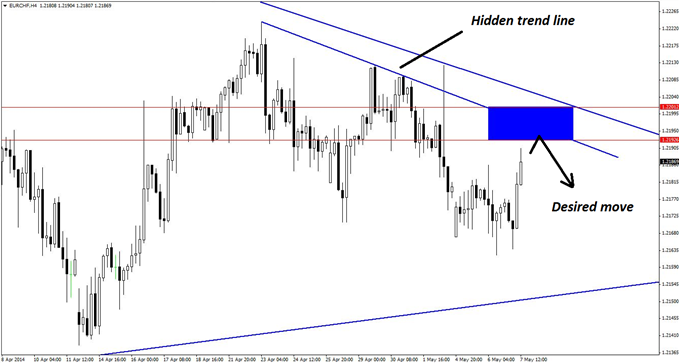
The four-hour chart below reveals a hidden line of resistance between the current price and the longer-term trend line. This quite conveniently permits a zone of resistance to be drawn at the blue box between 1.2192 and 1.2201.
This zone is ridiculously small and only 8 pips deep, but that is somewhat unsurprising given that EURCHF is a relatively docile pair.
Guest Commentary: Ultra-Small Resistance Zone for Selling EUR/CHF
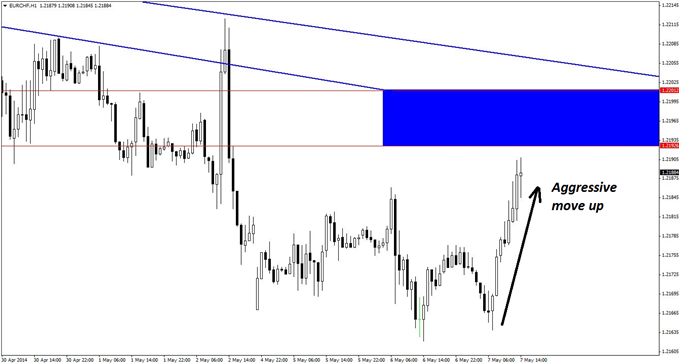
Nonetheless, an entry on the hourly chart (see below) would still be most preferable. Veteran traders occasionally brag about entries with tiny stop losses of only 8 or 12 pips, but in this case, it might actually be attainable.
Of course, the spread must be properly accounted for to avoid unnecessary stop-outs, however, short entries on bearish reversal divergence, pin bars, and/or bearish engulfing patterns would likely yield stop losses in that ultra-narrow range.
Guest Commentary: The Ideal Time Frame for Selling EUR/CHF
Given the prospects for this trade becoming a runner on the weekly chart, it is certainly worth two or three attempts to get in on this set-up using the shorter-term time frames!
By Kaye Lee, private fund trader and head trader consultant, StraightTalkTrading.com
original source


