Talking Points:
- GBP/USD currently trades above the 1.4400 level, with more support below
- US Non-farm Payrolls in focus as the market gears for possible volatility
- GSI is a powerful big data indicator that can help you determine whether short-term trends will continue or reverse
The GBP/USD currently trades above 1.4400 (at the time this report was written) as the pair seems to trade in anticipation for the US Non-farm Payrolls data later today. We look to find short term trading opportunities using the Grid Sight Index (GSI) indicator, as technical levels might prove influential throughout the day.
GBP/USD 5-Min GSI Chart: June 3, 2016
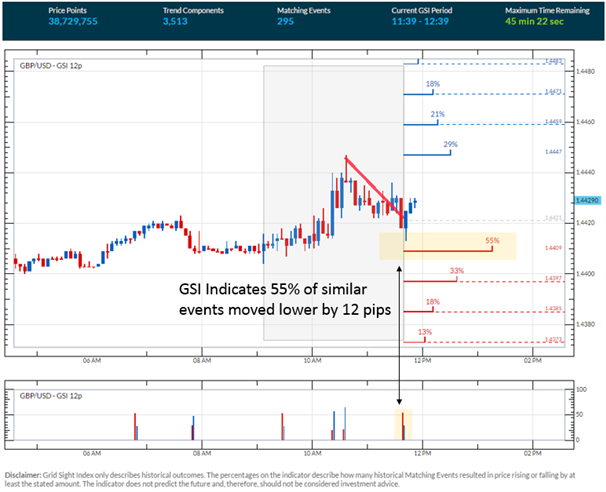
GSI is a powerful big data indicator that can give you a look at the market in a way that's never been possible before, analyzing millions of historical prices in real time. By matching events in the past, GSI describes how often the price moved in a certain direction.
You can learn more about the GSI here.
A common way to use GSI is to help you fade tops and bottoms, and trade breakouts. That’s why traders may want to use the GSI indicator when price reaches specific pre-determined levels, and fit a strategy in accordance with those levels that might offer a proper way to define risk.
You can use the DailyFX Support & Resistance tool to help determine key levels and volatility for a specific currency pair.

We use volatility measures as a way to better fit our strategy to market conditions. GBP/USD implied 1-month volatility measures has skyrocketed to the highest levels since February 2009 in anticipation of the EU referendum vote, which is set to take place June 23. The British Pound seems to generate significant responses on fluctuations of “Brexit” polls, as the price appears to be moving sideways on a higher time frame perspective.
Those volatility bursts may present ample opportunities for the shorter term oriented trader, but with the US Non-farm Payrolls data later today, the pair seems to be treading water in anticipation, which could signal that technical levels are likely to hold. With that being said, volatility might pick up following the event, which might imply that breakout trades may be preferable later today.
GBP/USD 30-Min Chart: June 3, 2016
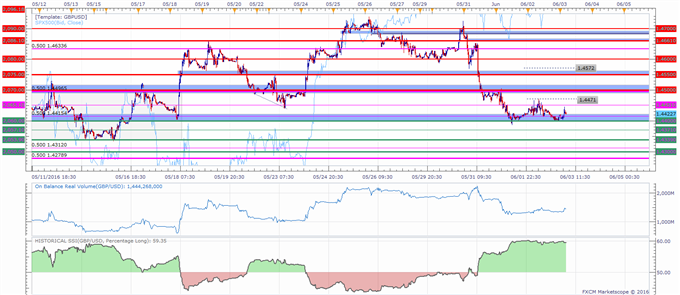
The GBP/USD is trading near support at 1.4400. Other levels of interest on a move lower may be 1.4371, followed by 1.4339. The 1.4300 level sits below with other short term support scattered around that area.
Immediate Resistance might be found at 1.4451, followed by 1.4471, and a very significant resistance zone around 1.4500. If the price breaks above that zone, the pair may find further resistance at around 1.4550.
When price reaches those levels, short term traders might use the GSI to view how prices reacted in the past given a certain momentum pattern, and see the distribution of historical outcomes in which the price reversed or continued in the same direction.
As mentioned before, caution may be warranted around the major event risk today.
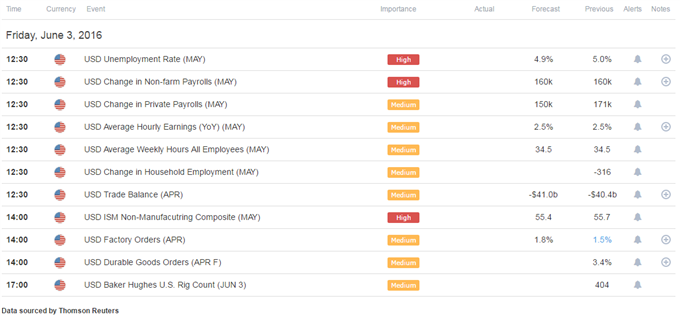
Click Here for the DailyFX Calendar
The US Non-farm Payrolls take center stage in early trade. The headline figure is expected to show 160k increase in payrolls, and the unemployment figure is expected to tick down to 4.9%.
With that said, Average Hourly Earnings might have higher significance today. In the context Fed rate hike bets, and with inflation seemingly the missing piece to further tightening, higher than expected wage figures might suggest inflation pressures are in the pipeline. In turn, this may send the US Dollar higher.
Meanwhile, the DailyFX Speculative Sentiment Index (SSI) is showing that about 59.3% of FXCM’s traders are long the GBP/USD at the time of writing. We use the SSI as a contrarian indicator, which implies further weakness ahead for the pair.
You can find more info about the DailyFX SSI indicator here
--- Written by Oded Shimoni, DailyFX Research
original source


