To receive James Stanley’s Analysis directly via email, please sign up here.
Talking Points:
- GBP/USD Technical Strategy: Price action is building ia longer-term wedge formation as we near the Brexit referendum.
- GBP/USD bounced off of the confluent support zone discussed last week after an abysmal NFP report created a rush of Dollar-weakness.
- If you’re looking for trading ideas, check out our Trading Guides. And if you want something more short-term in nature, check out our SSI indicator. If you’re looking at opening a trading account, FXCM has a contest at the beginning of next month for certain account holders. Click here for full details.
In our last article, we looked at a recent decline in GBP/USD after a series of polls indicated a higher-than-expected majority favoring the vote to ‘leave’ the European Union. And for the past three months, we’ve been hearing warnings from politicians, Central Bankers and numerous CEO’s of the dire consequences should the ‘Brexit’ vote win-out. At that last Super Thursday batch of announcements out of the Bank of England, Governor Mark Carney went so far as to say that should voters decide to leave, the UK economy was likely looking at higher unemployment, higher inflation, slower growth and sharp declines in the value of the British Pound.
This is like a death spiral for Central Bankers because at that point, they have to choose which direction to mold policy: Should they look at higher rates in an attempt to offset a weaker GBP and rampant inflation while sacrificing employment goals; or should they look to lower rates in the effort of encouraging employment, even at the behest of inflation, growth and spot rates in GBP?
Of course, it’s difficult to determine what might actually happen should voters decide to leave the EU; and with many polls showing a majority to leave or, at the very least, showing that this may not be a clear-cut decision to stay, this is something that British voters are obviously debating consequenes as well. This has been getting priced-in to GBP/USD of recent as price action has dug into a longer-term symmetrical wedge pattern as we move nearer to the Brexit referendum.
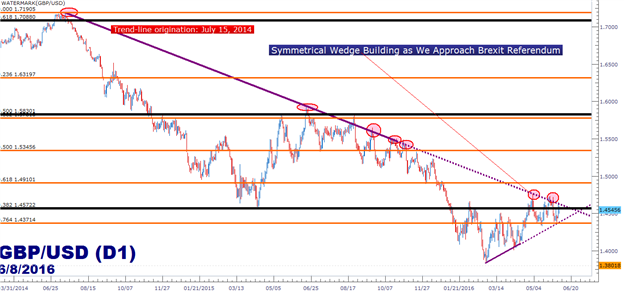
Created with Marketscope/Trading Station II; prepared by James Stanley
The symmetrical wedge pattern will often precede a breakout and with the Brexit referendum now just a little over two weeks away, the current price action structure makes sense. At issue is what traders should do about it?
There are a couple of options for approaching a symmetrical wedge: a) The trader can trade the short-term range, hoping that prices don’t breakout ahead of the referendum (against their position) or b) they can use current price action levels (the range) to devise a game plan for how to enter should/when the wedge finally breaks, whether its driven by the referendum or not.
On the chart below we take a shorter-term look at the current price action setup in GBP/USD. As you can see, support has been rather well defined while resistance has been a little more fleeting in nature, as indicated by the wider resistance zone than support. Because of this, traders would likely want to add a deeper buffer to resistance before looking to acquire long positions. At 1.4750 we have a psychological level along with a very recent price action inflection, and this could be the ‘knock-in’ level for traders to begin looking to buy a ‘higher low’ in GBP/USD. On the support side, traders could look to the zone spanning 1.4331 to 1.4371, which is the 76.4% Fibonacci retracement of the 2009-2014 major move in the pair.
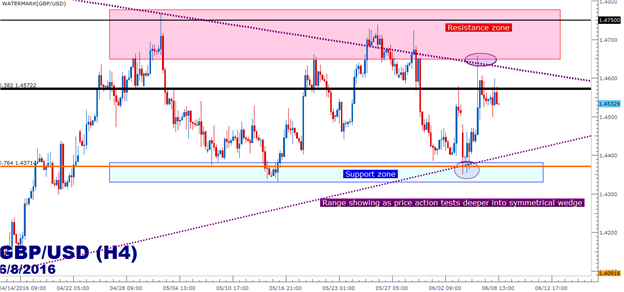
Created with Marketscope/Trading Station II; prepared by James Stanley
--- Written by James Stanley, Analyst for DailyFX.com
To receive James Stanley’s analysis directly via email, please SIGN UP HERE
Contact and follow James on Twitter: @JStanleyFX
original source
