NEW YORK, Sept. 09, 2019 (GLOBE NEWSWIRE) -- Aspen Group, Inc. (Nasdaq: ASPU)( “the Company or AGI”), an education technology holding company, today announced financial results for its 2020 fiscal first quarter ended July 31, 2019.
First Quarter Fiscal Year 2020 Summary
| Three months ended | ||||||||
| (in millions) | July 31, 2019 | July 31, 2018 | % Change | |||||
| Revenue | $10.4 | $7.2 | 43% | |||||
| Gross profit | $5.8 | $3.3 | 74% | |||||
| Gross profit margin (%) | 56% | 46% | 1,000 basis points | |||||
| Operating Income (Loss) | ($1.6) | ($2.9) | 43% | |||||
| Net Income (Loss) | ($2.1) | ($2.8) | 27% | |||||
| Cash Used in Operations | ($1.7) | ($3.4) | 50% | |||||
| EBITDA (Loss) | ($1.0) | ($2.3) | 58% | |||||
| Adjusted EBITDA (Loss) | ($0.1) | ($1.8) | 95% | |||||
First Quarter Performance Highlights
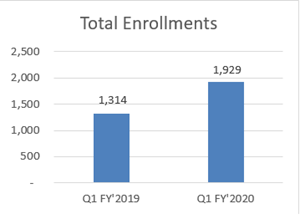
- New student enrollments increased to 1,929 or 46% year-over-year
º Aspen University (AU) new student enrollments increased to 1,415 or 29% year-over-year
º United States University (USU) new student enrollments increased to 514 or 133% year-over-year - Weighted average cost of enrollment declined 18%
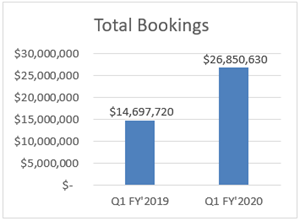
- Bookings increased 83% to $26.9 million
- Average revenue per enrollment (ARPU) increased 24% to $13,919
Michael Mathews, Chairman and CEO of AGI, commented, “Fiscal 2020 is off to a strong start with record revenue and enrollments in our seasonally weakest summer quarter. By focusing our marketing spend on delivering enrollment growth in the degree programs with the highest lifetime value (LTV), we expanded bookings in the quarter by 83% and increased our average revenue per enrollment, or ARPU, by 24%. For the remainder of fiscal year 2020 we expect to continue to focus on these highest LTV degree programs in order to accelerate our long-term growth. We are on track to deliver annual revenue growth over 34% in fiscal year 2020, based on anticipated year-over-year enrollment growth of approximately 25% and bookings forecasted to grow 35% to approximately $89 million. We now expect the company to achieve positive Adjusted EBITDA in the second fiscal quarter and for the foreseeable future.”
Fiscal 2020 First Quarter Financial and Operational Results:
AGI delivered 1,929 new student enrollments for the fiscal quarter ended July 31, 2019, a 46% increase year-over-year. Aspen University accounted for 1,415 new student enrollments (including 198 Doctoral enrollments and 276 Pre-licensure Bachelor of Science in Nursing (“BSN”) Arizona campus enrollments). USU accounted for 514 new student enrollments (primarily Family Nurse Practitioner (“FNP”) enrollments), a 133% increase year-over-year. Enrollments for Aspen University’s Pre-Licensure BSN program increased 48% sequentially as the university began accepting enrollments for prerequisite students taking online courses in anticipation of entering the HonorHealth final two-year core campus program that is expected to launch on September 17, 2019.
In the charts below, we have provided a comparison of enrollments and bookings* from Q1 fiscal year 2019 to Q1 fiscal year 2020. The company’s enrollments rose 46% year-over-year, while bookings increased 83% year-over-year. This translates to a 24% average revenue per user (ARPU)* increase year-over-year, from $11,185 to $13,919, driven by the company’s focused marketing spending on the highest LTV degree programs during the quarter.
| Lifetime Value (LTV) | Q1 FY'2019 | Q1 FY'2019 | Q1 FY'2020 | Q1 FY'2020 | ||||
| Per Enrollment | Enrollments | Bookings | Enrollments | Bookings | ||||
| AU Online (Nursing + Other) Unit | $ 7,350 | 882 | $ 6,482,700 | 941 | $ 6,916,350 | |||
| AU (Doctoral) Unit | $ 12,600 | 118 | $ 1,486,800 | 198 | $ 2,494,800 | |||
| AU (Pre-Licensure BSN) Unit | $ 30,000 | 93 | $ 2,790,000 | 276 | $ 8,280,000 | |||
| USU (FNP + Other) Unit | $ 17,820 | 221 | $ 3,938,220 | 514 | $ 9,159,480 | |||
| Total | 1,314 | $ 14,697,720 | 1,929 | $ 26,850,630 | ||||
| Average Revenue Per User (ARPU) | $ 11,185 | $ 13,919 | ||||||
Photos accompanying this announcement are available at
https://www.globenewswire.com/NewsRoom/AttachmentNg/d3a4a8a0-f728-4c09-95b3-ee6e68f50711
https://www.globenewswire.com/NewsRoom/AttachmentNg/da8fa2e1-18e0-48e3-833a-7dbb57344ab1
*“Bookings” are defined by multiplying LTV by new student enrollments for each operating unit. “Average Revenue Per User or (ARPU)” is defined by dividing total bookings by total enrollments.
AGI’s overall active student body (including both Aspen University and USU) grew 34% year-over-year from 7,274 to 9,752 students as of July 31, 2019.
Of the 9,752 total active students at both universities, 82% or 8,002 students are degree-seeking Nursing students.
Aspen University’s total active degree-seeking student body grew 25% year-over-year from 6,590 to 8,261 students. Aspen’s School of Nursing grew 36% year-over-year, from 4,863 to 6,595 active students, which includes 670 active students in the BSN Pre-Licensure program in Phoenix, AZ. Aspen University students paying tuition and fees through a monthly payment method grew by 17% year-over-year, from 4,769 to 5,580 students. Those 5,580 students paying through a monthly payment method represent 68% of Aspen University’s total active student body.
USU’s total active student body grew sequentially from 1,148 to 1,491 students or a sequential increase of 30%. On a year-over-year basis, USU’s total active student body grew from 684 to 1,491 students or 118%. USU’s MSN-FNP active student body grew sequentially from 970 to 1,294 students or a sequential increase of 33%. USU’s MSN-FNP program now represents 87% of USU’s active student body. USU students paying tuition and fees through a monthly payment method grew from 758 to 1,053 students sequentially. The 1,053 students paying through a monthly payment method represent 71% of USU’s total active student body.
Following the end of the fiscal first quarter of 2020, the Company announced a significant enrollment milestone of exceeding 10,000 total active students at Aspen University and United States University combined.
Revenues increased to $10,357,982 for the fiscal quarter ended July 31, 2019, an increase of 43% as compared to the prior fiscal year first quarter. USU accounted for approximately 26% and Aspen University’s Pre-Licensure BSN program accounted for approximately 8% of overall Company revenues.
Gross profit increased to $5,765,328 for the fiscal quarter ended July 31, 2019 or 56% gross margin. Aspen University gross profit represented 59% of Aspen University revenues for the fiscal quarter, while USU gross profit equaled 55% of USU revenues during the fiscal quarter. Aspen University instructional costs and services represented 18% of Aspen University revenues for the fiscal quarter, while USU instructional costs and services equaled 28% of USU revenues during the fiscal quarter. Aspen University marketing and promotional costs represented 20% of Aspen University revenues for the fiscal quarter, while USU marketing and promotional costs equaled 17% of USU revenues during the fiscal quarter.
Net loss applicable to shareholders was ($2,075,282) or diluted net loss per share of ($0.11). Aspen University generated $0.9 million of net income for the fiscal quarter, while USU experienced a net loss of ($0.4) million in the fiscal quarter. AGI corporate incurred $2.6 million of expenses for the first quarter.
EBITDA, a non-GAAP financial measure, was a loss of ($958,364) or (9%) as a percentage of revenue. Adjusted EBITDA, a non-GAAP financial measure, was a loss of ($86,099) or (1%) as a percentage of revenue. Aspen University generated $1.6 million of Adjusted EBITDA for the fiscal quarter, while USU experienced an Adjusted EBITDA loss of ($10,006) in the fiscal quarter. AGI corporate contributed $1.6 million of expenses toward the ($86,099) Adjusted EBITDA result for the fiscal quarter.
The Company used cash of $1.7 million in operations in the fiscal quarter, as compared to using $3.4 million in the prior fiscal year first quarter, an improvement of 50% year-over-year.
Conference Call:
AGI will host a conference call to discuss its fiscal year 2020 first quarter financial results and business outlook on Monday, September 9th, 2019, at 4:30 p.m. (ET). The conference call can be accessed by dialing toll-free (844) 452-6823 (U.S.) or (731) 256-5216 (international), passcode 2587764. Subsequent to the call, a transcript of the audiocast will be available from the Company’s website at ir.aspen.edu. There will also be a 7-day dial-in replay which can be accessed by dialing toll-free (855) 859-2056 or (404) 537-3406 (international), passcode 2587764.
Non-GAAP – Financial Measures:
This press release includes both financial measures in accordance with the Generally Accepted Accounting Principles, or GAAP, as well as non-GAAP financial measures. Generally, a non-GAAP financial measure is a numerical measure of a company’s performance, financial position or cash flows that either excludes or includes amounts that are not normally included or excluded in the most directly comparable measure calculated and presented in accordance with GAAP. Non-GAAP financial measures should be viewed as supplemental to, and should not be considered as alternatives to net income (loss), operating income (loss), and cash flow from operating activities, liquidity or any other financial measures. They may not be indicative of the historical operating results of AGI nor are they intended to be predictive of potential future results. Investors should not consider non-GAAP financial measures in isolation or as substitutes for performance measures calculated in accordance with GAAP.
Our management uses and relies on Adjusted EBITDA and EBITDA, each of which are non-GAAP financial measures. We believe that both management and shareholders benefit from referring to these non-GAAP financial measures in planning, forecasting and analyzing future periods. Our management uses these non-GAAP financial measures in evaluating its financial and operational decision making and as a means to evaluate period-to-period comparisons. Our management recognizes that the non-GAAP financial measures have inherent limitations because of the excluded items described below.
AGI defines Adjusted EBITDA as earnings (or loss) from continuing operations before the items in the table below including non-recurring charges of $132,949 in fiscal quarter ended July 31, 2019 and $188,665 in fiscal quarter ended July 31, 2018. Adjusted EBITDA is an important measure of our operating performance because it allows management, investors and analysts to evaluate and assess our core operating results from period-to-period after removing the impact of items of a non-operational nature that affect comparability.
We have included a reconciliation of our non-GAAP financial measures to the most comparable financial measures calculated in accordance with GAAP. We believe that providing the non-GAAP financial measures, together with the reconciliation to GAAP, helps investors make comparisons between AGI and other companies. In making any comparisons to other companies, investors need to be aware that companies use different non-GAAP measures to evaluate their financial performance. Investors should pay close attention to the specific definition being used and to the reconciliation between such measure and the corresponding GAAP measure provided by each company under applicable SEC rules.
The following table presents a reconciliation of Adjusted EBITDA to net loss allocable to common shareholders, a GAAP financial measure:
| Quarter Ended July 31, | ||||||||
| 2019 | 2018 | |||||||
| Net loss | $ | (2,075,282 | ) | $ | (2,837,276 | ) | ||
| Interest expense, net of interest income | 420,067 | 40,353 | ||||||
| Taxes | 90,277 | — | ||||||
| Depreciation & amortization | 606,574 | 498,105 | ||||||
| EBITDA (loss) | (958,364 | ) | (2,298,818 | ) | ||||
| Bad debt expense | 240,899 | 121,805 | ||||||
| Non-recurring charges | 132,949 | 188,665 | ||||||
| Stock-based compensation | 498,417 | 209,976 | ||||||
| Adjusted EBITDA (Loss) | $ | (86,099 | ) | $ | (1,778,372 | ) | ||
About Aspen Group, Inc.:
Aspen Group, Inc. is an education technology holding company that leverages its infrastructure and expertise to allow its two universities, Aspen University and United States University, to deliver on the vision of making college affordable again.
Forward-Looking Statements:
This press release contains forward-looking statements within the meaning of the Private Securities Litigation Reform Act of 1995 including statements regarding our continued focus on the highest LTV units, sustained revenue growth, enrollment growth, achieving and maintaining positive Adjusted EBITDA for the foreseeable future, and forecasted bookings. The words “believe,” “may,” “estimate,” “continue,” “anticipate,” “intend,” “should,” “plan,” “could,” “target,” “potential,” “is likely,” “will,” “expect” and similar expressions, as they relate to us, are intended to identify forward-looking statements. We have based these forward-looking statements largely on our current expectations and projections about future events and financial trends that we believe may affect our financial condition, results of operations, business strategy and financial needs. Important factors that could cause actual results to differ from those in the forward-looking statements include the continued high demand for nurses, the continued effectiveness of our marketing efforts, unanticipated delays in opening new campuses, failure to continue to obtain enrollments at low acquisition costs and keeping instructional costs down, potential student attrition and national and local economic factors. Other risks are included in our filings with the SEC including our Form 10-K for the year ended April 30, 2019. Any forward-looking statement made by us herein speaks only as of the date on which it is made. Factors or events that could cause our actual results to differ may emerge from time to time, and it is not possible for us to predict all of them. We undertake no obligation to publicly update any forward-looking statement, whether as a result of new information, future developments or otherwise, except as may be required by law.
Investor Relations Contact:
Kim Rogers
Managing Director
Hayden IR
385-831-7337
Kim@HaydenIR.com
ASPEN GROUP, INC. AND SUBSIDIARIES
CONSOLIDATED BALANCE SHEETS
| July 31, 2019 | April 30, 2019 | |||||||
| (Unaudited) | ||||||||
| Assets | ||||||||
| Current assets: | ||||||||
| Cash | $ | 7,243,580 | $ | 9,519,352 | ||||
| Restricted cash | 452,021 | 448,400 | ||||||
| Accounts receivable, net of allowance of $1,484,559 and $1,247,031, respectively | 10,786,265 | 10,656,470 | ||||||
| Prepaid expenses | 546,767 | 410,745 | ||||||
| Other receivables | 1,435 | 2,145 | ||||||
| Total current assets | 19,030,068 | 21,037,112 | ||||||
| Property and equipment: | ||||||||
| Call center equipment | 245,715 | 193,774 | ||||||
| Computer and office equipment | 330,267 | 327,621 | ||||||
| Furniture and fixtures | 1,430,349 | 1,381,271 | ||||||
| Software | 4,765,597 | 4,314,198 | ||||||
| 6,771,928 | 6,216,864 | |||||||
| Less accumulated depreciation and amortization | (2,083,277 | ) | (1,825,524 | ) | ||||
| Total property and equipment, net | 4,688,651 | 4,391,340 | ||||||
| Goodwill | 5,011,432 | 5,011,432 | ||||||
| Intangible assets, net | 8,266,667 | 8,541,667 | ||||||
| Courseware, net | 145,063 | 161,930 | ||||||
| Accounts receivable, secured - net of allowance of $625,963 and $625,963, respectively | 45,329 | 45,329 | ||||||
| Long term contractual accounts receivable | 4,249,969 | 3,085,243 | ||||||
| Debt issue cost, net | 271,162 | 300,824 | ||||||
| Right of use lease asset | 7,996,585 | — | ||||||
| Deposits and other assets | 562,594 | 629,626 | ||||||
| Total assets | $ | 50,267,520 | $ | 43,204,503 | ||||
ASPEN GROUP, INC. AND SUBSIDIARIES
CONSOLIDATED BALANCE SHEETS (CONTINUED)
| July 31, 2019 | April 30, 2019 | |||||||
| (Unaudited) | ||||||||
| Liabilities and Stockholders’ Equity | ||||||||
| Current liabilities: | ||||||||
| Accounts payable | $ | 1,588,331 | $ | 1,699,221 | ||||
| Accrued expenses | 577,755 | 651,418 | ||||||
| Deferred revenue | 2,681,037 | 2,456,865 | ||||||
| Refunds due students | 1,591,632 | 1,174,501 | ||||||
| Deferred rent, current portion | 53,140 | 47,436 | ||||||
| Convertible notes payable, current portion | 50,000 | 50,000 | ||||||
| Right of use lease liability, current portion | 1,100,411 | — | ||||||
| Other current liabilities | 279,411 | 270,786 | ||||||
| Total current liabilities | 7,921,717 | 6,350,227 | ||||||
| Senior secured loan payable, net of discount of $287,626 and $353,328 respectively | 9,712,374 | 9,646,672 | ||||||
| Right of use lease liability | 7,095,695 | — | ||||||
| Deferred rent | 704,689 | 746,176 | ||||||
| Total liabilities | 25,434,475 | 16,743,075 | ||||||
| Commitments and contingencies – see Note 10 | ||||||||
| Stockholders’ equity: | ||||||||
| Preferred stock, $0.001 par value; 1,000,000 shares authorized, | ||||||||
| 0 issued and outstanding at July 31, 2019 and April 30, 2019 | — | — | ||||||
| Common stock, $0.001 par value; 40,000,000 shares authorized | ||||||||
| 18,913,527 issued and 18,896,443 outstanding at July 31, 2019 | ||||||||
| 18,665,551 issued and 18,648,884 outstanding at April 30, 2019 | 18,914 | 18,666 | ||||||
| Additional paid-in capital | 69,146,123 | 68,562,727 | ||||||
| Treasury stock (16,667 shares) | (70,000 | ) | (70,000 | ) | ||||
| Accumulated deficit | (44,261,992 | ) | (42,049,965 | ) | ||||
| Total stockholders’ equity | 24,833,045 | 26,461,428 | ||||||
| Total liabilities and stockholders’ equity | $ | 50,267,520 | $ | 43,204,503 | ||||
ASPEN GROUP, INC. AND SUBSIDIARIES
CONSOLIDATED STATEMENTS OF OPERATIONS
(Unaudited)
| Three Months Ended | ||||||||
| July 31, | ||||||||
| 2019 | 2018 | |||||||
| Revenues | $ | 10,357,982 | $ | 7,221,305 | ||||
| Operating expenses | ||||||||
| Cost of revenues (exclusive of depreciation and amortization shown separately below) | 4,353,058 | 3,752,392 | ||||||
| General and administrative | 7,037,150 | 5,824,132 | ||||||
| Depreciation and amortization | 606,574 | 498,105 | ||||||
| Total operating expenses | 11,996,782 | 10,074,629 | ||||||
| Operating loss | (1,638,800 | ) | (2,853,324 | ) | ||||
| Other income (expense) | ||||||||
| Other income | 22,802 | 56,401 | ||||||
| Interest expense | (423,689 | ) | (40,353 | ) | ||||
| Total other income/(expense), net | (400,887 | ) | 16,048 | |||||
| Loss before income taxes | (2,039,687 | ) | (2,837,276 | ) | ||||
| Income tax expense | 35,595 | — | ||||||
| Net loss | $ | (2,075,282 | ) | $ | (2,837,276 | ) | ||
| Net loss per share allocable to common stockholders - basic and diluted | $ | (0.11 | ) | $ | (0.15 | ) | ||
| Weighted average number of common stock outstanding - basic and diluted | 18,733,317 | 18,317,830 | ||||||
ASPEN GROUP, INC. AND SUBSIDIARIES
CONSOLIDATED STATEMENTS OF CHANGES IN STOCKHOLDERS’ EQUITY
(Unaudited)
| Additional | Total | |||||||||||||||||||||||
| Common Stock | Paid-In | Treasury | Accumulated | Stockholders’ | ||||||||||||||||||||
| Shares | Amount | Capital | Stock | Deficit | Equity | |||||||||||||||||||
| Balance at April 30, 2019 | 18,665,551 | $ | 18,666 | $ | 68,562,727 | $ | (70,000 | ) | $ | (42,049,965 | ) | $ | 26,461,428 | |||||||||||
| Stock-based compensation | — | — | 498,417 | — | — | 498,417 | ||||||||||||||||||
| Common stock issued for cashless stock options exercised | 101,894 | 102 | (102 | ) | — | — | — | |||||||||||||||||
| Common stock issued for stock options exercised for cash | 21,876 | 22 | 45,168 | — | — | 45,190 | ||||||||||||||||||
| Common stock issued for cashless warrant exercise | 19,403 | 19 | (19 | ) | — | — | — | |||||||||||||||||
| Amortization of warrant based cost | — | — | 9,440 | — | — | 9,440 | ||||||||||||||||||
| Amortization of restricted stock issued for service | — | — | 30,597 | — | — | 30,597 | ||||||||||||||||||
| Restricted Stock Issued for Services, subject to vesting | 104,803 | 105 | (105 | ) | — | — | — | |||||||||||||||||
| Cumulative effect of Adoption of ASC 842 | — | — | — | — | (136,745 | ) | (136,745 | ) | ||||||||||||||||
| Net loss | — | — | — | — | (2,075,282 | ) | (2,075,282 | ) | ||||||||||||||||
| Balance at July 31, 2019 | 18,913,527 | $ | 18,914 | $ | 69,146,123 | $ | (70,000 | ) | $ | (44,261,992 | ) | $ | 24,833,045 | |||||||||||
| Additional | Total | |||||||||||||||||||||||
| Common Stock | Paid-In | Treasury | Accumulated | Stockholders’ | ||||||||||||||||||||
| Shares | Amount | Capital | Stock | Deficit | Equity | |||||||||||||||||||
| Balance at April 30, 2018 | 18,333,521 | $ | 18,334 | $ | 66,557,005 | $ | (70,000 | ) | $ | (32,771,748 | ) | $ | 33,733,591 | |||||||||||
| Stock-based compensation | — | — | 209,976 | — | — | 209,976 | ||||||||||||||||||
| Common stock issued for cashless stock options exercised | 5,230 | 5 | (5 | ) | — | — | — | |||||||||||||||||
| Common stock issued for stock options exercised for cash | 2,689 | 2 | 7,815 | — | — | 7,817 | ||||||||||||||||||
| Purchase of treasury stock, net of broker fees | — | — | — | (7,370,000 | ) | — | (7,370,000 | ) | ||||||||||||||||
| Re-sale of treasury stock, net of broker fees | — | — | — | 7,370,000 | — | 7,370,000 | ||||||||||||||||||
| Fees associated with equity raise | — | — | (29,832 | ) | — | — | (29,832 | ) | ||||||||||||||||
| Net loss | — | — | — | — | (2,837,276 | ) | (2,837,276 | ) | ||||||||||||||||
| Balance at July 31, 2018 | 18,341,440 | $ | 18,341 | $ | 66,744,959 | $ | (70,000 | ) | $ | (35,609,024 | ) | $ | 31,084,276 | |||||||||||
ASPEN GROUP, INC. AND SUBSIDIARIES
CONSOLIDATED STATEMENTS OF CASH FLOWS
(Unaudited)
| Three months ended | ||||||||
| July 31, | ||||||||
| 2019 | 2018 | |||||||
| Cash flows from operating activities: | ||||||||
| Net loss | $ | (2,075,282 | ) | $ | (2,837,276 | ) | ||
| Adjustments to reconcile net loss to net cash used in operating activities: | ||||||||
| Bad debt expense | 240,899 | 121,805 | ||||||
| Depreciation and amortization | 606,574 | 498,105 | ||||||
| Stock-based compensation | 498,417 | 209,976 | ||||||
| Warrants issued for services | 9,440 | — | ||||||
| Loss on asset disposition | 20,240 | — | ||||||
| Amortization of debt discounts | 65,702 | — | ||||||
| Amortization of debt issue costs | 29,662 | — | ||||||
| Amortization of prepaid shares for services | — | 8,285 | ||||||
| Non-cash payments to investor relations firm | 30,597 | — | ||||||
| Changes in operating assets and liabilities: | ||||||||
| Accounts receivable | (1,535,420 | ) | (1,592,941 | ) | ||||
| Prepaid expenses | (136,022 | ) | (229,168 | ) | ||||
| Other receivables | 710 | 173,475 | ||||||
| Other assets | 67,032 | — | ||||||
| Accounts payable | (110,890 | ) | (728,230 | ) | ||||
| Accrued expenses | (73,663 | ) | 10,401 | |||||
| Deferred rent | (35,783 | ) | 217,433 | |||||
| Refunds due students | 417,131 | 302,609 | ||||||
| Deferred revenue | 224,172 | 430,015 | ||||||
| Right of use assets, net | 62,776 | — | ||||||
| Other liabilities | 8,625 | 27,301 | ||||||
| Net cash used in operating activities | (1,685,083 | ) | (3,388,210 | ) | ||||
| Cash flows from investing activities: | ||||||||
| Purchases of courseware and accreditation | (2,275 | ) | (42,917 | ) | ||||
| Purchases of property and equipment | (629,983 | ) | (735,757 | ) | ||||
| Net cash used in investing activities | (632,258 | ) | (778,674 | ) | ||||
| Cash flows from financing activities: | ||||||||
| Disbursements for equity offering costs | — | (29,832 | ) | |||||
| Proceeds of stock options exercised and warrants exercised | 45,190 | 7,817 | ||||||
| Purchase of treasury stock, net of broker fees | — | (7,370,000 | ) | |||||
| Re-sale of treasury stock, net of broker fees | — | 7,370,000 | ||||||
| Net cash provided by (used in) financing activities | 45,190 | (22,015 | ) | |||||
| Net (decrease) in cash and cash equivalents | (2,272,151 | ) | (4,188,899 | ) | ||||
| Cash, restricted cash, and cash equivalents at beginning of period | 9,967,752 | 14,803,065 | ||||||
| Cash and cash equivalents at end of period | $ | 7,695,601 | $ | 10,614,166 | ||||
| Supplemental disclosure cash flow information | ||||||||
| Cash paid for interest | $ | 324,861 | $ | — | ||||
| Cash paid for income taxes | $ | — | $ | — | ||||
| Supplemental disclosure of non-cash investing and financing activities | ||||||||
| Common stock issued for services | $ | 178,447 | $ | — | ||||
ASPEN GROUP, INC. AND SUBSIDIARIES
CONSOLIDATED STATEMENTS OF CASH FLOWS (CONTINUED)
(Unaudited)
The following table provides a reconciliation of cash and restricted cash reported within the consolidated balance sheet that sum to the same such amounts shown in the consolidated statement of cash flows:
| Three months ended | ||||||||
| July 31, | ||||||||
| 2019 | 2018 | |||||||
| Cash | $ | 7,243,580 | $ | 10,423,660 | ||||
| Restricted cash | 452,021 | 190,506 | ||||||
| Total cash and restricted cash | $ | 7,695,601 | $ | 10,614,166 | ||||
![]()
Total Enrollments
Total Enrollments
Total Bookings