Executive Summary
- Perseus has achieved another quarterly gold production record, producing 112,786 ounces of gold, up 10% on the
June 2021 quarter and up 28% on theMarch 2021 quarter. - Weighted average production cost of
US$857 per ounce and a weighted average all-in site cost (AISC) ofUS$966 per ounce,US$81 per ounce or 8% less than in the last quarter. - The Yaouré
Gold Mine was the major contributor to the Group’s strong quarterly result, producing 64,558 ounces of gold at an AISC ofUS$671 per ounce, generating notional cashflow ofUS$65.8 million . - Gold sales increased to 107,650 ounces at an average realised gold price of
US$1,655 per ounce giving rise to a weighted average cash margin ofUS$689 per ounce of gold produced. - Notional cashflow from operations was
US$77.8 million ,US$15.7 million or 25% more than in theJune 2021 quarter.
Table 1: Operating and Financial Summary
| PERFORMANCE INDICATOR | UNIT | CALENDAR 2021 YEAR TO DATE | ||||
| Gold recovered | Ounces | 88,458 | 102,788 | 191,246 | 112,786 | 304,032 |
| Gold poured | Ounces | 86,042 | 105,468 | 191,510 | 110,535 | 302,044 |
| Production Cost1 | US$/ounce | 852 | 921 | 894 | 857 | 880 |
| All-In Site Cost (AISC)1 | US$/ounce | 999 | 1,047 | 1,030 | 966 | 1,003 |
| Gold sales | Ounces | 87,215 | 106,899 | 194,114 | 107,650 | 301,764 |
| Average sales price1 | US$/ounce | 1,628 | 1,652 | 1,642 | 1,655 | 1,647 |
| Notional Cashflow1 | US$ million | 41.2 | 62.1 | 103.3 | 77.8 | 181.2 |
Notes: 1. Includes Yaouré data from
- Group gold production and AISC market guidance remain unchanged for the
December 2021 half year at 225,000 to 255,000 ounces at an ASIC ofUS$925 toUS$1,025 per ounce. - At
30 September 2021 , available cash and bullion on hand ofUS$196.2 million and debt ofUS$100.0 million , giving a net cash position ofUS$96.2 million ,US$40.1 million more than at the end of last quarter. - Exploration programmes on the Nkosuo prospect near Edikan and the CMA Underground prospect at Yaouré returned excellent drill results confirming the potential for strong organic growth of the Group’s inventory of Mineral Resources and Ore Reserves at each mine.
- Perseus has continued to strengthen its strong sustainability performance relative to our safety, social and environmental objectives and targets. The fully documented results as well as our approach to maintaining a sustainable business is contained in our third consolidated Sustainability Report covering the period
1 July 2020 to30 June 2021 .
OPERATIONS
GROUP PRODUCTION, COSTS AND NOTIONAL CASHFLOW
Perseus’s three operating gold mines, Yaouré and Sissingué in Côte d’Ivoire, and Edikan in
Table 2: Cost and Production Summary by Mine
| MINE | TOTAL GOLD PRODUCED (OUNCES) | ALL-IN SITE COST (US$/OUNCE) | ||||
QUARTER | QUARTER | QUARTER | QUARTER | QUARTER | QUARTER | |
| Yaouré1 | 22,095 | 37,343 | 64,558 | - | 1,036 | 671 |
| Sissingué | 25,539 | 23,224 | 16,067 | 675 | 676 | 931 |
| Edikan | 40,824 | 42,221 | 32,161 | 1,202 | 1,217 | 1,574 |
| 88,458 | 102,788 | 112,786 | 999 | 1,047 | 966 | |
Gold sales from all three operations totalled 107,650 ounces, 1% more than last quarter. The weighted average gold price realised from sales of gold during the quarter was
Table 3: Realised Gold Price and Notional Cash Flow by Mine
| MINE | REALISED GOLD PRICE (US$ PER OUNCE) | NOTIONAL CASH FLOW FROM OPERATIONS (US$ MILLION) | ||||
QUARTER | QUARTER | QUARTER | QUARTER | QUARTER | QUARTER | |
| Yaouré1 | - | 1,684 | 1,690 | - | 24.2 | 65.8 |
| Sissingué | 1,693 | 1,637 | 1,624 | 26.0 | 20.5 | 11.1 |
| Edikan | 1,574 | 1,628 | 1,602 | 15.2 | 17.4 | 0.9 |
| 1,628 | 1,652 | 1,655 | 41.2 | 62.1 | 77.8 | |
Notes: 1. All costs and sales associated with gold produced at Yaouré in the
Production and cost guidance for the
Table 4: Production and Cost Guidance
| PARAMETER | UNITS | (ACTUAL) | (FORECAST) | 2021 CALENDAR YEAR (FORECAST) |
| Yaouré | ||||
| Production | Ounces | 59,438 | 130,000 – 140,000 | 189,438 – 199,438 |
| All-in Site Cost | USD per ounce | 1,036 | 675 – 775 | 790 – 850 |
| Sissingué | ||||
| Production | Ounces | 48,763 | 25,000 – 35,000 | 73,763 – 83,763 |
| All-in Site Cost | USD per ounce | 715 | 950 – 1,070 | 825 – 885 |
| Production | Ounces | 83,045 | 70,000 – 80,000 | 153,046 – 163,046 |
| All-in Site Cost | USD per ounce | 1,213 | 1,350 – 1,450 | 1,270 – 1,330 |
| PERSEUS GROUP | ||||
| Production | Ounces | 191,246 | 225,000 – 255,000 | 416,247 – 446,247 |
| All-in Site Cost | USD per ounce | 1,030 | 925 – 1,025 | 975 – 1,035 |
YAOURÉ GOLD MINE, CÔTE D’IVOIRE
During the quarter, Yaouré increased its quarterly gold production by 73% to 64,558 ounces of gold at a production cost of
Yaouré’s excellent result was achieved despite an unusually high 715 millimetres of rain that fell on the Yaouré site during the quarter, periodically disrupting the mining schedule and access to high grade ore. Several mechanical failures during the quarter also required urgent maintenance and temporarily disrupted crushing and grinding operations for short periods. Notwithstanding these challenges and greatly assisted by the availability of higher-grade fresh ore from the CMA pit and materially better than expected gold recovery rates, production levels were maintained close to targets and well in line with Half Year production guidance.
The rise in unit mining costs during the quarter was largely a function of a larger proportion of the mined material requiring drilling and blasting as well as the reduced tonnes of material mined due to the wet weather. Unit processing costs were higher due to higher maintenance costs due to mechanical failures, higher grinding costs due to an increase in the proportion of fresh ore in the feed and slightly higher power costs due to running the newly commissioned standby power generators for short periods of time offsetting the impact of an increase in tonnes of ore processed.
AISCs at
Table 5: Yaouré Quarterly Performance
| PARAMETER | UNIT | 2021 CALENDAR YEAR TO DATE | ||||
| Gold Production & Sales | ||||||
| Total material mined | Tonnes | 8,816,630 | 8,162,858 | 16,979,488 | 6,340,478 | 23,319,966 |
| Total ore mined | Tonnes | 163,476 | 496,144 | 659,620 | 1,070,285 | 1,729,905 |
| Average ore grade | g/t gold | 0.82 | 1.37 | 1.23 | 2.07 | 1.75 |
| Strip ratio | t:t | 52.9 | 15.45 | 24.74 | 4.92 | 12.48 |
| Ore milled | Tonnes | 624,827 | 837,350 | 1,462,177 | 913,530 | 2,375,707 |
| Milled head grade | g/t gold | 1.27 | 1.51 | 1.4 | 2.37 | 1.77 |
| Gold recovery | % | 86.8 | 92.09 | 90.01 | 92.7 | 91.6 |
| Gold produced | ounces | 22,095 | 37,343 | 59,438 | 64,558 | 123,996 |
| Gold sales2 | ounces | 11,918 | 42,264 | 54,182 | 60,055 | 114,237 |
| Average sales price1 | US$/ounce | - | 1,684 | 1,692 | 1,690 | 1,691 |
| Unit Production Costs1 | ||||||
| Mining cost | US$/t mined | - | 2.71 | 2.71 | 2.95 | 2.82 |
| Processing cost | US$/t milled | - | 9.90 | 9.90 | 13.74 | 11.90 |
| G & A cost | US$M/month | - | 1.70 | 1.70 | 1.89 | 1.80 |
| All-In Site Cost1 | - | |||||
| Production cost | US$/ounce | - | 951 | 951 | 572 | 711 |
| Royalties | US$/ounce | - | 83 | 83 | 85 | 84 |
| Sub-total | US$/ounce | - | 1,033 | 1,033 | 657 | 795 |
| Sustaining capital | US$/ounce | - | 3 | 3 | 14 | 10 |
| Total All-In Site Cost3 | US$/ounce | - | 1,036 | 1,036 | 671 | 805 |
| Notional Cash Flow from Operations1 | - | |||||
| Cash Margin | US$/ounce | - | 648 | 648 | 1,019 | 883 |
| Notional Cash Flow | US$M | - | 24.2 | 24.2 | 65.8 | 109.5 |
Notes:
1. Includes Yaouré data from declaration of Commercial Production on
2. Gold sales are recognised in Perseus’s accounts when gold is delivered to the customer from Perseus’s metal account.
3. Included in the AISC for the quarter is
MINERAL RESOURCE TO MILL RECONCILIATION
The reconciliation of processed ore tonnes, grade and contained gold relative to the Yaouré Mineral Resource block model during the quarter, last six and nine-month periods are shown in Table 6. During the last three months, 8% more ore tonnes at 6% lower grade have been produced compared to the Mineral Resource model. Over each of the last six and nine-month periods of operation, Yaouré has produced slightly more metal than predicted by the Mineral Resource model. The performance of the Yaouré Mineral Resource model to date is considered satisfactory.
Table 6: Yaouré
| PARAMETER | BLOCK MODEL TO MILL CORRELATION FACTOR | ||
| 3 MONTHS | 6 MONTHS | 9 MONTHS | |
| Tonnes of Ore | 1.08 | 1.12 | 1.04 |
| Head Grade | 0.94 | 0.98 | 1.01 |
| Contained Gold | 1.02 | 1.09 | 1.05 |
SISSINGUÉ GOLD MINE, CÔTE D’IVOIRE
During the quarter, and slightly ahead of expectations, 16,067 ounces of gold were produced at Sissingué at a production cost of
The overall result for the quarter, while less than that achieved in the
Unit production costs for the quarter at
AISCs at
MINERAL RESOURCE TO MILL RECONCILIATION
The reconciliation of processed ore tonnes, grade and contained ounces relative to the Sissingué Mineral Resource block model on which mine plans are based is shown in Table 8. During the last three months, grade control has predicted less tonnes (18%) with a similar grade (2%) resulting in less ounces (19%) when compared to the Mineral Resource Estimate (MRE). Other reconciliation factors remain stable (F2 to F4), indicating the Mineral Resource estimate is currently underperforming in tonnage. This trend is being monitored to determine if the decrease is due to smaller volumes being mined and accuracy of end-of-month surveys due to rainwater prohibiting access. Over the last six and 12-month periods, Sissingué has produced more metal than predicted by the Mineral Resource model, primarily because of grade control outlining increased tonnages of ore. Perseus regards the overall outperformance as being within normal industry standards but continue to monitor trends.
UPDATED LIFE OF MINE PLAN FOR the SISSINGUÉ PRECINCT
An updated Life of Mine Plan for the Sissingué Precinct that models ore being mined at each of the Sissingué, Fimbiasso and Bagoé Mining Leases, and trucked to the Sissingué plant for processing, is being prepared and will be published when finalised. Based on preliminary numbers it appears likely that the life of the Sissingué operation can be extended by several years. Current work is focussing on the sequencing of mining to optimise the return on the investment of capital required to access the new mining areas.
Table 7: Sissingué Quarterly Performance
| PARAMETER | UNIT | QUARTER | QUARTER | HALF YEAR | QUARTER | 2021 CALENDAR YEAR TO DATE | |
| Gold Production & Sales | |||||||
| Total material mined | Tonnes | 1,047,159 | 690,977 | 1,738,136 | 395,727 | 2,133,863 | |
| Total ore mined | Tonnes | 515,902 | 335,650 | 851,552 | 162,912 | 1,014,464 | |
| Average ore grade | g/t gold | 2.34 | 1.80 | 2.13 | 1.52 | 2.03 | |
| Strip ratio | t:t | 1.0 | 1.1 | 1.0 | 1.43 | 1.10 | |
| Ore milled | Tonnes | 269,373 | 327,043 | 596,416 | 299,757 | 896,173 | |
| Milled head grade | g/t gold | 3.13 | 2.42 | 2.70 | 1.91 | 2.44 | |
| Gold recovery | % | 93.7 | 91.4 | 92.6 | 87.1 | 91.2 | |
| Gold produced | ounces | 25,539 | 23,224 | 48,763 | 16,067 | 64,830 | |
| Gold sales1 | ounces | 33,847 | 21,672 | 55,519 | 18,250 | 73,769 | |
| Average sales price | US$/ounce | 1,693 | 1,637 | 1,670 | 1,624 | 1,659 | |
| Unit Costs | |||||||
| Mining cost | US$/t mined | 5.40 | 7.30 | 6.20 | 9.62 | 6.83 | |
| Processing cost | US$/t milled | 18.61 | 19.00 | 18.8 | 19.4 | 19.00 | |
| G & A cost | US$M/month | 0.99 | 1.10 | 1.05 | 1.24 | 1.11 | |
| All-In Site Costs | |||||||
| Production cost | US$/ounce | 533 | 628 | 580 | 830 | 642 | |
| Royalties | US$/ounce | 102 | 114 | 107 | 94 | 104 | |
| Sub-total | US$/ounce | 635 | 742 | 687 | 924 | 746 | |
| Sustaining capital | US$/ounce | 40 | 12 | 28 | 7 | 23 | |
| Total All-In Site Cost | US$/ounce | 675 | 754 | 715 | 931 | 769 | |
| Notional Cash Flow from Operations | |||||||
| Cash Margin | US$/ounce | 1,018 | 883 | 956 | 693 | 890 | |
| Notional Cash Flow | US$M | 26.0 | 20.5 | 46.6 | 11.1 | 57.7 | |
Notes: 1. Gold sales are recognised in Perseus’s accounts when gold is delivered to the customer from Perseus’s metal account.
Table 8: Sissingué
| PARAMETER | BLOCK MODEL TO MILL CORRELATION FACTOR | ||
| 3 MONTHS | 6 MONTHS | 1 YEAR | |
| Tonnes of Ore | 0.82 | 0.97 | 1.13 |
| Head Grade | 0.98 | 1.03 | 0.98 |
| Contained Gold | 0.81 | 1.00 | 1.11 |
BAGOÉ
Work by consultants (CECAF), on preparing an Environmental and Social Impact Assessment for the Bagoé exploration permit area advanced during the quarter. Once completed, this document together with the recently completed Definitive Feasibility Study of an operation involving mining and trucking of ore from three satellite deposits located on the Bagoé exploration permit to the Sissingué process plant, will be lodged with the
EDIKAN GOLD MINE, GHANA
In the
This performance was driven principally by the grade of the ore that was processed by the mill during the quarter. All other key operating parameters including mill run time, throughput rate, quantity of ore milled and recovery were in line with forecasts. Ore from the AG pit, ROM and heap leach stockpiles and a small amount of material mined from the remnants of the Stage 2 Fetish pit were blended in varying proportions, dependent on availability and fed to the mill.
The head grade of ore fed to the mill during the quarter averaged 0.72 g/t gold which was well below the average grade of prior quarters. This reduced head grade was caused by several factors, including poor equipment availability by the mining contractor generating a shortfall in availability of fresh ore from the AG pit for processing, creating the need for mill feed to be supplemented by low grade ore drawn from the ROM stockpile. Compounding this problem, the grade of the fresh ore mined that was mined from the
Production costs for the quarter at
The quarterly AISC at
Table 9 summarises the key performance statistics at Edikan during the quarter as well as in prior periods.
Table 9: Edikan Quarterly Performance
| PARAMETER | UNIT | QUARTER | QUARTER | HALF YEAR | QUARTER | 2021 CALENDAR YEAR TO DATE | |
| Gold Production & Sales | |||||||
| Total material mined | Tonnes | 7,266,051 | 7,563,884 | 14,829,935 | 7,823,678 | 22,653,613 | |
| Total ore mined | Tonnes | 887,650 | 1,081,133 | 1,968,783 | 788,612 | 2,757,395 | |
| Average ore grade | g/t gold | 1.06 | 1.10 | 1.08 | 0.92 | 1.03 | |
| Strip ratio | t:t | 7.2 | 6.00 | 6.5 | 8.9 | 7.2 | |
| Ore milled | Tonnes | 1,595,443 | 1,684,992 | 3,280,435 | 1,731,146 | 5,011,581 | |
| Milled head grade | g/t gold | 0.95 | 0.92 | 0.93 | 0.72 | 0.86 | |
| Gold recovery | % | 85.1 | 85.0 | 85.0 | 80.2 | 83.6 | |
| Gold produced | ounces | 40,824 | 42,221 | 83,045 | 32,161 | 115,206 | |
| Gold sales1 | ounces | 41,450 | 42,962 | 84,412 | 29,345 | 113,757 | |
| Average sales price | US$/ounce | 1,574 | 1,628 | 1602 | 1,602 | 1,602 | |
| Unit Costs | |||||||
| Mining cost | US$/t mined | 3.10 | 3.30 | 3.22 | 3.36 | 3.27 | |
| Processing cost | US$/t milled | 10.20 | 9.00 | 9.60 | 8.56 | 9.24 | |
| G & A cost | US$M/month | 1.36 | 1.38 | 1.39 | 1.78 | 1.52 | |
| All-In Site Costs | |||||||
| Production cost | US$/ounce | 1,051 | 1,057 | 1,054 | 1,445 | 1,163 | |
| Royalties | US$/ounce | 121 | 91 | 106 | 98 | 104 | |
| Sub-total | US$/ounce | 1,172 | 1,148 | 1,160 | 1,543 | 1,267 | |
| Sustaining capital | US$/ounce | 30 | 69 | 53 | 32 | 44 | |
| Total All-In Site Cost2 | US$/ounce | 1,202 | 1,217 | 1,213 | 1,574 | 1,311 | |
| Cash Margin | US$/ounce | 372 | 411 | 389 | 28 | 291 | |
| Notional Cash Flow | US$M | 15.2 | 17.4 | 32.6 | 0.9 | 33.5 | |
Notes:
1. Gold sales are recognised in Perseus’ accounts when gold is delivered to the customer from Perseus’ metal account.
2. Included in the AISC for the quarter is
MINERAL RESOURCE TO MILL RECONCILIATION
Reconciliation of processed tonnes and grade of ore relative to the Mineral Resource block models for Edikan’s Fetish and AG pit indicated a continuation of the deteriorating performance of the Resource model recorded in prior periods. The reconciliation figures for the three, six, and twelve-month periods to 30 September are shown in Table 10 below.
Table 10: Edikan Block Model to Mill Reconciliation
| PARAMETER | BLOCK MODEL TO MILL CORRELATION FACTOR | ||
| 3 MONTHS | 6 MONTHS | 1 YEAR | |
| Tonnes of Ore | 0.78 | 0.87 | 0.89 |
| Head Grade | 0.81 | 0.84 | 0.87 |
| Contained Gold | 0.63 | 0.73 | 0.77 |
The key drivers of the poor reconciliation are largely understood, and changes are in the process of being implemented to address the issues going forward.
SUSTAINABILITY
COVID UPDATE
In response to a third wave of COVID -19 that spread in
During the quarter, we experienced 66 new cases of COVID-19, with over half of the cases occurring at Edikan with the remaining cases spread evenly across Sissingué and Yaouré. Case occurrence at Edikan reduced as the quarter progressed following several vaccination campaigns, with around 74 per cent of employees and contractors at the site now partially or fully vaccinated. Vaccination campaigns also progressed at Sissingué, with 25 per cent of employees and contractors now partially or fully vaccinated. Efforts continue to improve vaccination rates at Yaouré which remain low. In the coming quarter we will continue to pursue vaccination for our employees and contractors as vaccines become available under government programs.
SUSTAINABILITY GOVERNANCE
During the quarter, Perseus continued to strengthen its sustainability governance by:
- Releasing our third consolidated sustainability report, for the period
1 July 2020 to30 June 2021 , aligning our Sustainability Report with our Annual and Financial Reporting cycle. This has further embedded our integrated approach to financial, operational and sustainability performance. - Broadening our reported sustainability metrics in our FY2022 business performance scorecards (linked to executive remuneration) beyond safety to also include social and environmental metrics.
- Completing external assurance of our FY2021 sustainability data and advancing our alignment with the World Gold Council Responsible Gold Mining Principles, starting with a review of our health, safety and social risks and their control and governance.
- Developing our three-year sustainability strategic plan to strengthen our financial value and grow our social value by actively supporting the countries in which we operate to advance their progress on the United Nations Sustainable Development Goals.
SUSTAINABILITY PERFORMANCE
This quarter, Perseus continued our strong sustainability performance relative to our social and environmental objectives and targets, as shown below in Table 11 and summarised as follows:
- Safety: Our record of zero fatalities across the operations was maintained.
- Social:
- Perseus’s economic contribution to our host countries of
Ghana and Côte d’Ivoire of aroundUS$125million (70% of revenue), included approximatelyUS$100 million paid to local suppliers,US$11 million paid as salaries and wages to local employees,US$15 million in payments to government as taxes, royalties and other payments, andUS$430,000 in social investment. - Local and national employment was maintained at 95% of our total direct workforce.
- Zero significant community issues occurred.
- Perseus’s economic contribution to our host countries of
- Environment:
- Scope 1 and 2 greenhouse gas emissions and water use per ounce of gold produced continued to decrease as production at Yaouré ramped up.
- A study was commenced to investigate the potential for wholly or partially replacing the diesel fired back-up generators at Yaouré with a longer-term power solution involving either the full or partial use of renewable energy sources including solar and or wind power. The study will also look at the benefits of partially replacing grid power with renewable energy sources.
- Zero environmental events, or tailings dam integrity issues occurred during the period.
In achieving the above, the following key challenges to Sustainability of its business were encountered by Perseus during the quarter:
- Total Recordable Injury Frequency Rates (TRIFR) at each mine to the end of the
September 2021 quarter were Edikan 1.89, Sissingué 0.5 and Yaouré 3.24 respectively. The Group Edikan and Yaouré results are currently falling short of their 2022 Financial Year TRIFR continuous improvement targets while Sissingué remains on track to achieve its targets. - Perseus and its contractors have experienced an increase in offsite road transport safety events during the quarter at each of Edikan, Sissingué and Yaouré mines. Scoping and planning for a safety improvement program across the Group is in progress, with implementation scheduled to commence in late calendar year 2021.
- Illegal mining activities on Perseus’s mining and exploration licence areas continues to present challenges for the Company in both
Ghana and Côte d’Ivoire. The Company is continuing to work closely with relevant government authorities to control these activities that have proven to negatively impact both the environmental and social fabric of local communities. - Security risks at Sissingué and satellite exploration activity areas (Fimbiasso and Bagoé) are being closely monitored due to ongoing political and social unrest which has given rise to terrorist activities in
Mali which lies immediately to the north of our Sissingué mine.
Table 4: Sustainability Quarterly Performance
| PERFORMANCE DRIVER | SUB-AREA | METRIC | UNIT | FY2021 | |||
| Governance | Compliance | Material legal non-compliance | Number | 0 | 0 | ||
| Social | Workplace fatalities | Number | 0 | 0 | |||
| Total Recordable Injury Frequency (TRIF) | Total Recordable Injuries per million hours worked, rolling 12 months | Edikan - 1.49 Sissingué - 1.47 Yaouré - 1.59 Exploration - 1.92 Group - 1.76 | Edikan - 1.89 Sissingué - 0.50 Yaouré - 3.24 Exploration - 2.80 Group - 1.85 | ||||
| Lost Time Injury Frequency (LTIFR) | Lost Time Injuries (LTIFR) per million hours worked, rolling 12 months | Edikan - 0.37 Sissingué - 0.00 Yaouré - 1.59 Exploration - 0.00 Group - 0.45 | Edikan - 0.38 Sissingué - 0.00 Yaouré - 1.30 Exploration - 1.40 Group - 0.46 | ||||
| COVID-19 Cases | Number | 24 | 66 | ||||
| Community | Number of significant2 community events | Number | 0 | 0 | |||
| Community investment | US$ | ||||||
| Economic Benefit | Proportion local and national employment | % of total employees | 95 | % | 95 | % | |
| Proportion local and national procurement | % of total procurement | 81 | % | 74 | % | ||
| Gender Diversity | Board gender diversity | % | 33 | % | 33 | % | |
| Executive gender diversity | % | 40 | % | 40 | % | ||
| Proportion of women employees | % | 14.7%1 | 13.8%1 | ||||
| Responsible Operations | Environment | Number of significant2 environmental events | Number | 0 | 0 | ||
| Tailings | Number of significant2 tailings dam integrity failures | Number | 0 | 0 | |||
| Water stewardship | Water used per ounce of gold produced | M3/oz | 13.8 | 6.91 | |||
| Greenhouse Gas Emissions | Scope 1 and 2 Greenhouse Gas Emissions per ounce of gold produced | Tonnes of CO2-e/oz | 0.63 | 0.57 | |||
Notes:
1. Permanent employees only
2. An event with a severity rating of 4 or above, based on Perseus’s internal severity rating (tiered from 1 to 5 by increasing severity) as per our Risk Management framework
EXPLORATION
CÔTE D’IVOIRE EXPLORATION
YAOURÉ EXPLORATION & EXPLOITATION PERMITS
Exploration activities during the quarter on the Yaouré exploitation permit focused on drilling at the CMA Underground and CMA East seismic prospects, both within two kilometres of the Yaouré mill. Refer to ASX Announcement “Positive Exploration Results at Perseus’s Yaouré Mine” dated
Other drilling programs conducted on the Yaouré tenements during the quarter, included air core (AC) drilling at Degbezere, and reverse circulation (RC) and diamond drilling (DD) at the CMA SW and Kongonza prospects (Appendix 1 – Figure 1.1). In all, 9,619 metres of RC and 6,272 metres of DD were drilled across the Yaouré exploitation permit during the quarter.
Work at the CMA Underground prospect focused on infill drilling to firm up previously defined underground resources extending below the currently planned CMA pit. Perseus defined an Inferred Mineral Resource of 1.8 million tonnes grading 6.1 g/t Au, extending to a maximum 275m down dip beneath the open pit resource with potential to extend mineralisation further down dip beyond this. Perseus has also completed a Scoping Study which identified the potential to mine the CMA structure using underground mining methods (refer to ASX release entitled “Perseus Mining Completes Scoping Study for
Due to the imminent cutback of the CMA South open pit, and likely loss of suitable sites for drill pads, the first stage of down-dip drilling focused on the southern end of the CMA structure where grades are generally lower than at the northern end. Drilling to date has comprised 6,476.7m in 34 RC pre-collared DD holes, infilling the existing 50 x 50m coverage to a nominal 25 x 25m pattern to allow conversion of the Inferred resource to Indicated. Results to date from the infill drilling program have been encouraging, with intercepts generally consistent with those previously encountered in both thickness and grade. The style of mineralisation is also consistent with previous intersections, comprising pervasive, moderate to strong, pink-pale brown albite and carbonate alteration developed within a well-defined structure marked by quartz carbonate veins, fault veins, multi dilatant fault breccia, cataclasis and shearing.
Step-out drilling to investigate the next 300m down-dip from the current CMA Underground resource has also commenced, with 2,512m of RC pre-collars drilled in 27 holes. Drilling of diamond tails to complete these holes to their targeted depth has commenced, with 827.3m drilled in two holes. The step-out program is guided by Perseus’s early 2020 3D seismic survey that clearly identified the CMA structure extending to depth beyond the current drill coverage. Drilling is being undertaken on an initial 100 x 200m pattern to better define the position of the CMA structure and the intensity of mineralisation. If results are encouraging, this will be infilled to 100 x 100m to allow an initial Inferred Mineral Resource Estimate. The results from the CMA Underground infill and extension drilling received to date demonstrate the potential for the Company to materially grow its gold inventory at Yaouré organically, as is more fully detailed in the Company’s ASX release of
Drilling to test near-surface extensions of CMA look-alike structures in the hanging wall of the main CMA structure, now termed the CMA East prospect continued, with 1,426 metres drilled in 17 RC holes. Results from this drilling, plus drilling conducted in the previous quarter, were also reported in detail in the Company’s ASX release of
Limited extensional drilling was conducted at both the CMA SW (previously CMA South Extension) and Angovia 2 prospects. At CMA SW, two DD holes were drilled into the link between the CMA SW structure and the Sayikro prospect, whilst 913 metres were drilled in 16 RC holes at Angovia 2 to determine the western limits of the deposit. Results from these programs are being evaluated.
On the Yaouré West exploration permit AC drilling was undertaken at the Degbezere prospect, with 2,122 metres drilled in 42 holes, whilst augering continued along the Degbezere NE trend, with 1,952 metres drilled in 149 holes. The AC drilling and augering covers the
BAGOÉ EXPLORATION PERMIT
No drilling was conducted on the Bagoé permit during the
MINIGNAN EXPLORATION PERMIT
Results from a 3,020-metre auger drilling program on Perseus’s Minignan exploration permit located in north-western Côte d’Ivoire were received. Gold values were generally weak, with no coherent zones of significant anomalism identified. As a result, the Company plans to relinquish this property.
AGYAKUSU OPTION
As fully reported in Perseus’s ASX announcement entitled “Exploration Success for Perseus in Ghana” dated
Drilling now underway at Nkosuo, will focus on closing up the current hole spacing to 40 x 40 metres and ultimately to locally 20 x 20 metres to support a maiden Mineral Resource Estimate to be undertaken in the
In anticipation that this work will lead to a positive outcome, Perseus is in the process of exercising its option over the Agyakusu permit. Early work to meet the requirements of the ESIA process is also being planned to enable an application for a
AGYAKUSU-DML OPTION
A planned AC drilling program to test gold-in-soil anomalism along the main structural/intrusive corridor extending SW from the Nkosuo prospect on the adjoining Agyakusu permit has been deferred in favour of an initial lower impact auger program (Appendix A - Figure 1.3). Auger drilling is expected to commence during the next quarter.
DOMENASE OPTION
Planned first-pass soil sampling covering the main structural/intrusive corridors on this property is being planned, following the expected signing of an option agreement over the property in October.
EXPLORATION EXPENDITURE
Expenditure on exploration activities throughout
Table 5:
| REGION | UNITS | QUARTER | QUARTER | HALF YEAR | QUARTER | 2021 CALANDAR YEAR TO DATE |
| US$ million | 0.46 | 0.39 | 0.85 | 2.14 | 2.99 | |
| Côte d’Ivoire | ||||||
| Sissingué | US$ million | 1.86 | 2.55 | 4.41 | 1.10 | 5.51 |
| Yaouré | US$ million | 2.43 | 3.52 | 5.95 | 4.16 | 10.11 |
| Regional | US$ million | 0.12 | 0.07 | 0.19 | 0.25 | 0.44 |
| Sub-total | US$ million | 4.41 | 6.14 | 10.55 | 5.52 | 16.07 |
| Total | US$ million | 4.87 | 6.53 | 11.40 | 7.66 | 19.06 |
GROUP FINANCIAL POSITION
CASHFLOW AND BALANCE SHEET (UNAUDITED)
Perseus achieved yet another strong quarter of cash generation, with a
Based on the spot gold price of
The graph below (Figure 1) shows the notional operating cash flows from the three mines, the largest single driver of cash movement, and how this compares historically over the past 2.5 years. Note that “Notional Operating Cash Flow” is obtained by multiplying average sales price less AISC (the “notional margin”) by the ounces of gold recovered.
Figure 1: Notional Operating Cashflow is available at https://www.globenewswire.com/NewsRoom/AttachmentNg/128a9479-9163-4093-bcb7-d710de7eeb6d
The overall movement in cash and bullion during the quarter is shown below in Figure 2. Aside from the operating margin, other relevant movements are, Australian and West African corporate costs (
Figure 2: Quarterly cash and bullion movements is available at https://www.globenewswire.com/NewsRoom/AttachmentNg/47e30c07-9565-4c01-b057-eeb31a28ba36
GOLD PRICE HEDGING
At the end of the quarter, Perseus held gold forward sales contracts for 209,985 ounces of gold at a weighted average sales price of
Perseus’s hedge position has decreased slightly by 132 ounces since the end of the
Hedging contracts currently provide downside price protection to approximately 20% of Perseus’s currently forecast gold production for the next three years, leaving 80% of forecast production potentially exposed to movements (both up and down) in the gold price.
PLANNED ANNOUNCEMENTS FOR
- 13 October – Edikan Exploration Update
- 14 October – Yaouré Exploration Update
- 18 October – FY2021 Sustainability Report
- 18 October - FY2021 Annual Report
- November – Sissingué Life of Mine Update
- 25 November - Annual General Meeting
10 December 2021 – Payment of Capital Return (subject to Shareholder approval)
This market announcement was authorised for release by the board of
COMPETENT PERSON STATEMENT:
All production targets referred to in this report are underpinned by estimated Ore Reserves which have been prepared by competent persons in accordance with the requirements of the JORC Code.
Edikan. The information in this report that relates to AF Gap Mineral Resources and Ore Reserve estimate was first reported by the Company in a market announcement “Perseus Mining Updates Mineral Resources and Ore Reserves” released on
Sissingué, Fimbiasso, Bagoé. The information in this report that relates to Mineral Resource and Ore Reserve estimates for the Fimbiasso deposits was first reported by the Company in a market announcement “Perseus Mining Updates Mineral Resources and Ore Reserves” released on
Yaouré. The information in this report that relates to
The information in this report relating to exploration results was first reported by the Company in compliance with the JORC Code 2012 and NI43-101 in market updates “Exploration Success for Perseus in Ghana” released on
CAUTION REGARDING FORWARD LOOKING INFORMATION:
This report contains forward-looking information which is based on the assumptions, estimates, analysis and opinions of management made in light of its experience and its perception of trends, current conditions and expected developments, as well as other factors that management of the Company believes to be relevant and reasonable in the circumstances at the date that such statements are made, but which may prove to be incorrect. Assumptions have been made by the Company regarding, among other things: the price of gold, continuing commercial production at the Yaouré
| ASX/TSX CODE: PRU CAPITAL STRUCTURE: Ordinary shares: 1,226,969,570 Performance rights: 26,741,697 REGISTERED OFFICE: Level 2 Subiaco WA 6008 Telephone: +61 8 6144 1700 Email: IR@perseusmining.com www.perseusmining.com | DIRECTORS: Mr Non-Executive Chairman Mr Managing Director & CEO Ms Non-Executive Director Mr Non-Executive Director Mr Non-Executive Director Mr Non-Executive Director Non-Executive Director | CONTACTS: Managing Director & CEO jeff.quartermaine@perseusmining.com Corporate Communications +61 414 558 202 claire.hall@perseusmining.com Media Relations +61 4 20 582 887 nathan.ryan@nwrcommunications.com.au |
APPENDIX 1 – FIGURES
Figure 1.1: Yaouré
Figure 1.2: Sissingué
Figure 1.3:

![]()
Figure 1
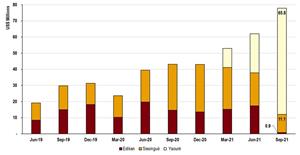
Notional Operating Cashflow
Figure 2
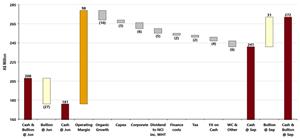
Quarterly cash and bullion movements
Figure 1.1
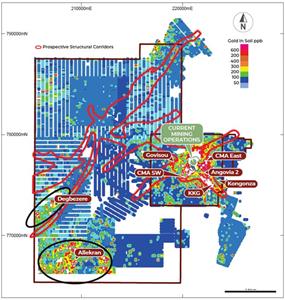
Yaouré Gold Project – Tenements and Prospects
Figure 1.2
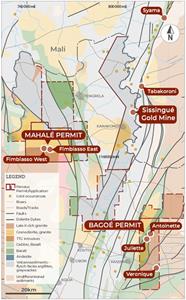
Sissingué Gold Mine and Bagoé Project – Tenements and Prospects
Figure 1.3
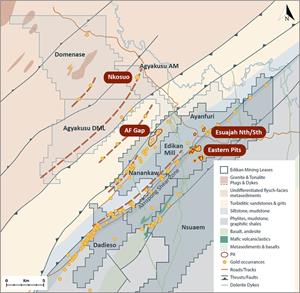
Edikan Gold Mine – Regional Geology, Tenements and Prospects
2021 GlobeNewswire, Inc., source

