The updated mineral resource for the VG deposit comprises near-surface Inferred Resources of 267,600 ounces of gold (5,264,000 tonnes at an average grade of 1.62 g/t gold), representing a 16% increase in Inferred Resources compared to a historical 2014 resource estimate(1) which remains open in multiple directions. The VG deposit is located approximately 11km north of the Company’s flagship White Gold property hosts the Company’s Golden Saddle and Arc deposits which have a combined mineral resource of 1,139,900 ounces Indicated at 2.28 g/t Au and 402,100 ounces Inferred at 1.39 g/t Au(1). Mineralization at the Golden Saddle and Arc is also known to extend beyond the limits of the current resource estimate.
Highlights Include:
- The VG deposit is located on the QV property and 11km north of the Company’s Golden Saddle and Arc deposits.
- Gold mineralization at the VG deposit appears very similar to that at the Company’s Golden Saddle deposit.
- Opportunities exist at the VG deposit to quickly upgrade a significant portion of Inferred Resources to Indicated, as well as for expansion of mineralization at depth and along strike.
- Several other prospective targets on the property have received limited exploration work and offer potential for additional discoveries.
- The 2021 work program continues to demonstrate extensive gold mineralization in the White Gold district and the potential for new discoveries and continuing to increase the Company’s significant defined resource base.
Figures accompanying this news release can be found at: https://whitegoldcorp.ca/investors/exploration-highlights/
“We are very pleased to have increased the resources at the VG deposit with very limited drilling since acquiring the project in 2019, and feel confident that excellent opportunities exist to quickly upgrade and further expand the resources, further increasing our already significant and growing defined resource base in the
Resource Estimate Details
The current resource estimate for the VG deposit was carried out by Arseneau Consulting Services (“ACS”) and is reported in accordance with the guidelines of the Canadian Securities Administrators National Instrument 43-101 (“NI 43-101”) and has been estimated in conformity with generally accepted CIM “Estimation and Mineral Resource and Mineral Reserve Best Practices” guidelines. Mineral resources are not mineral reserves and do not have demonstrated economic viability.
The current resource estimate incorporates assay results from 23 diamond drill holes (4,324m) and 8 reverse circulation (RC) drill holes (870m). An additional 24 rotary air blast (RAB) drill holes totalling 1,758 m were utilized to assist modelling the mineralized zones, but were not used in grade estimation. All drilling except for the 8 RC holes drilled by the Company in 2019 was completed between 2012 and 2017 by the previous owner, Comstock Metals Ltd. (“Comstock”, TSX-V: CSL). This compares to 16 diamond drill holes (3,278m) having been used for the historical 2014 resource estimate.
The Mineral Resource Estimate for the VG deposit, with an effective date of
Table 1. VG Deposit Mineral Resource Statement, Effective Date
| Classification | Cut-Off Grade | Tonnes | Grade | Contained Au |
| (g/t Au) | (g/t Au) | (ounces) | ||
| Inferred | 0.5 | 5,264,000 | 1.62 | 267,600 |
Notes:
- The Mineral Resource Estimate has been constrained to a preliminary optimized pit shell, using gold recovery of 92%, operating costs of
CDN$33.50 /tonne, pit slope=50 degrees, SG=2.65, and a gold price ofUS$1,600 per troy ounce. - Mineral Resources were estimated by Ordinary Kriging in 20m by 20m by 10m blocks.
- Top cuts to each of the estimated zones were applied with capping values between 3 g/t to 10 g/t Au.
- A fixed bulk density of 2.65 t/m3 was assigned to the model based on the average of all density measurements collected from the mineralized zones.
- Mineral resources were prepared in accordance with NI 43-101, Companion Policy 43-101CP, and the CIM Definition Standards for Mineral Resources and Mineral Reserves. Mineral resources that are not mineral reserves do not have demonstrated economic viability.
- Rounding may result in apparent summation differences between tonnes, grade, and contained metal content.
Table 2. Summary of Mineral Resources,
| Indicated Resource | Inferred Resource | |||||||
| Deposit | Tonnage | Grade | Contained Gold | Tonnage | Grade | Contained Gold | ||
| (000's) | (g/t) | (ounces) | (000's) | (g/t) | (ounces) | |||
| Golden Saddle - Near Surface | 14,815 | 2.31 | 1,098,300 | 3,454 | 1.43 | 159,100 | ||
| Golden Saddle - Underground | 143 | 4.53 | 20,800 | 326 | 4.33 | 45,300 | ||
| Arc - Near Surface | 613 | 1.06 | 20,800 | 5,221 | 1.18 | 197,700 | ||
| TOTAL | 15,571 | 2.28 | 1,139,900 | 9,001 | 1.39 | 402,100 | ||
| Indicated Resource | Inferred Resource | |||||||
| Deposit | Tonnage | Grade | Contained Gold | Tonnage | Grade | Contained Gold | ||
| (000's) | (g/t) | (ounces) | (000's) | (g/t) | (ounces) | |||
| VG - Near Surface | -- | -- | -- | 5,264 | 1.62 | 267,600 | ||
The Mineral Resource estimate is based on the combination of geological modeling, geostatistics, and conventional block modeling using the Ordinary Kriging method of grade interpolation in Geovia GEMS software. Four mineralization solids were created to outline mineralization domains greater than 0.5 g/t Au. The solids constrained drill hole intercepts were composited into 2.0 m lengths with all unsampled values assigned zero grade. Gold grades for the model were estimated in three successive passes. The first pass used a search ellipse with dimensions of 95 m X 30 m X 9 m in the X, Y, and Z directions respectively which represents 80% of the correlogram ranges. Pass two used the full correlogram range of 120 m X 37 m X 11 m in the X, Y, and Z directions respectively. The third pass search ellipse doubled the correlogram range in the Y and Z directions. For all three passes a minimum of 6 and maximum of 20 composites were required to generate a resource block, with no more than 5 composite allowed from any one drill hole. Resources were estimated into non rotated blocks with dimensions of 20 m X 20 m X 10 m in the X, Y and Z dimensions respectively. Top cuts to each of the estimated zones were applied with capping values ranging from 3 g/t to 10 g/t Au.
About
The Company owns a portfolio of 21,111 quartz claims across 31 properties covering over 420,000 hectares representing over 40% of the Yukon’s emerging
(1)
(2)
(3)
(4)
Cautionary Note Regarding Forward Looking Information
This news release contains "forward-looking information" and "forward-looking statements" (collectively, "forward-looking statements") within the meaning of the applicable Canadian securities legislation. All statements, other than statements of historical fact, are forward-looking statements and are based on expectations, estimates and projections as at the date of this news release. Any statement that involves discussions with respect to predictions, expectations, beliefs, plans, projections, objectives, assumptions, future events or performance (often but not always using phrases such as "expects", or "does not expect", "is expected", "anticipates" or "does not anticipate", "plans", “proposed”, "budget", "scheduled", "forecasts", "estimates", "believes" or "intends" or variations of such words and phrases or stating that certain actions, events or results "may" or "could", "would", "might" or "will" be taken to occur or be achieved) are not statements of historical fact and may be forward-looking statements. In this news release, forward-looking statements relate, among other things, the Company’s objectives, goals and exploration activities conducted and proposed to be conducted at the Company’s properties; future growth potential of the Company, including whether any proposed exploration programs at any of the Company’s properties will be successful; exploration results; and future exploration plans and costs and financing availability.
These forward-looking statements are based on reasonable assumptions and estimates of management of the Company at the time such statements were made. Actual future results may differ materially as forward-looking statements involve known and unknown risks, uncertainties and other factors which may cause the actual results, performance or achievements of the Company to materially differ from any future results, performance or achievements expressed or implied by such forward-looking statements. Such factors, among other things, include: the expected benefits to the Company relating to the exploration conducted and proposed to be conducted at the White Gold properties; failure to identify any additional mineral resources or significant mineralization; the preliminary nature of metallurgical test results; uncertainties relating to the availability and costs of financing needed in the future, including to fund any exploration programs on the Company’s properties; business integration risks; fluctuations in general macroeconomic conditions; fluctuations in securities markets; fluctuations in spot and forward prices of gold, silver, base metals or certain other commodities; fluctuations in currency markets (such as the Canadian dollar to
Neither the TSXV nor its Regulation Services Provider (as that term is defined in the policies of the TSXV) accepts responsibility for the adequacy or accuracy of this news release.
For Further Information, Please Contact:
Contact Information:
David D’Onofrio
Chief Executive Officer
(647) 930-1880
ir@whitegoldcorp.ca
To Book a Meeting with Management: https://whitegoldcorp.ca/contact/request-information/
Photos accompanying this announcement are available at
https://www.globenewswire.com/NewsRoom/AttachmentNg/03f1dfcd-d3ad-4bd8-9448-639a052466a7
https://www.globenewswire.com/NewsRoom/AttachmentNg/5c71879e-5553-4462-9491-a196dd04b9a5
https://www.globenewswire.com/NewsRoom/AttachmentNg/4701bc63-163c-426f-881a-fe5b6b19b78c

![]()
Figure 1
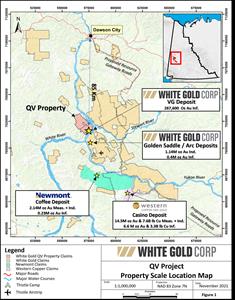
Regional Location map
Figure 2
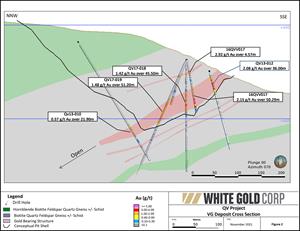
VG Cross Section
Figure 3
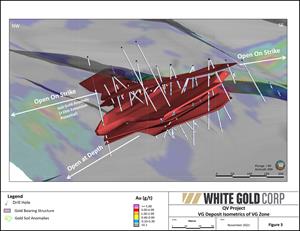
VG Isometric
2021 GlobeNewswire, Inc., source
