All figures are in
| |||||||||||||||||||||||||||||||||||||||||||||||||||||||
- Net earnings of
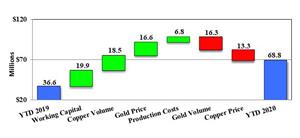
$80.7 million and adjusted net earningsNG of$97.8 million ,$0.27 and$0.33 per common share (basic), respectively. - Cash flow from operations was
$268.1 million . - Production totalled 219,692 ounces of gold and 19.1 million pounds of copper.
- Production costs per ounce of gold sold were
$410 per ounce. - Production costs per pound of copper sold were
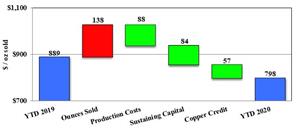
$1.20 per pound. - All-in sustaining costs on a by-product basis per ounce soldNG were
$804 per ounce. - Cash position of
$212 million at quarter end with total liquidity of$712 million . As atJune 30, 2020 , the Company’s$500 million corporate credit facility was undrawn. - Commercial production achieved on
May 31, 2020 at the Öksüt Mine which generated positive operating cash flow of$13.5 million and free cash flowNG of$5.0 million during the quarter. - Robust spring melt at
Mount Milligan resulting in stored water inventory in excess of 6 million cubic metres at the end of the second quarter. - An updated Kumtor 43-101 technical report is expected to be released in the fall of 2020.
- No change to 2020 production and cost guidance and a modification to growth capitalNG guidance.
- Quarterly Dividend increased by 25% to
C$0.05 per common share.
All references in this document denoted with NG, indicate a non-GAAP term which is discussed under “Non-GAAP Measures” and reconciled to the most directly comparable GAAP measure.
Commentary
“The strong operating performance at Kumtor and
“Financially, the Company generated
“The decision of Centerra’s Board to increase the quarterly dividend by 25% to
COVID-19 Update
Centerra continues to prioritize the health, safety and well-being of its employees, contractors, communities and other stakeholders during the current outbreak of COVID-19 and to take steps to minimize the effect of the pandemic on its business. Centerra has taken a series of measures to provide its employees with accurate information, help prevent infection and reduce the potential transmission of COVID-19, including activation of a global crisis management team, frequent communication with and compassionate support of all our people, travel restrictions, and the temporary closure of various administration offices including our head office in Toronto. Each Centerra site rapidly and successfully implemented proactive measures to minimize the impact of COVID-19 on operations, including strict protocols for access to operating sites, temperature checks and questioning upon entry, increased cleaning and hygiene protocols, modifications to work shifts and accommodation at site and an offsite quarantine facility established specifically for employees travelling to the
The Company completed a company-wide COVID-19 employee survey in June to obtain feedback from employees on Centerra’s response to the pandemic and most importantly, on whether the Company is keeping employees well-informed and providing adequate support both physically and emotionally. The responses company-wide were favorable and Centerra will continue to address concerns and adapt its practices as necessary throughout the stages of this crisis.
While the majority of Centerra’s operating sites are currently operating without significant interruption, there has been an increase in the infection rates of COVID-19 and other illnesses in the
The Company notes that the effects of COVID-19 on its business continue to change rapidly. The measures enacted to date reflect the Company’s best assessment at this time but will remain flexible and be revised as necessary or advisable and/or as recommended by the public health and governmental authorities.
Exploration Update
Exploration activities in the second quarter of 2020 included drilling, surface sampling, geological mapping and geophysical surveying at the Company’s various projects (including earn-in properties); targeting gold and copper mineralization in
The 2020 planned drilling program at Kumtor includes 55,000 metres of exploration and 15,000 metres of infill drilling, which are focused on priority primary and potential targets. Primary targets include various zones of the Central, Southwest and Sarytor deposits (areas) based on enhanced geological modelling from the recently updated Kumtor resource block model, and positive drilling results from 2018 and 2019. In addition, the 2020 planned drilling program at Kumtor includes the underexplored segments of the Kumtor Gold Trend – the Northeast targets, Bordoo, Akbel and conceptual targets (
In April, due to COVID-19 preventive measures, exploration drilling at Kumtor was temporarily suspended, resuming in
During the second quarter of 2020, exploration drilling programs continued with the completion of fifteen diamond drill holes for 4,663 metres. Exploration drilling focused on testing zones of sulfide and oxide mineralization along the corridor between the Central and Southwest pits (Kosholuu, Hope and Southwest Oxide Deep zones), on the periphery of the
Southwest Deposit (Area)
In the second quarter of 2020, a total of eleven diamond drill holes were completed in the Southwest area for a total of 2,902 metres.
Three drill holes have been completed between Southwest and Central pits in the
Hole SW-20-319 intersected broad dispersed gold mineralization in Tertiary sediments.
Significant intersections are reported below:
| SW-20-313 | 9.0 metres @ 1.13 g/t Gold (“Au”), from 277.8 metres 4.3 metres @ 4.78 g/t Au from 289.2 metres |
| SW-20-319 | 39.0 metres @ 0.45 g/t Au from 19.6 metres Including 15.0 metres @ 0.92 g/t Au from 29.6 metres |
In the
| SW-20-318 | 15.9 metres @ 1.65 g/t Au from 196.8 metres 10.4 metres @ 4.29 g/t Au from 221.7 metres |
| SW-20-320 | 18.3 metres @ 6.50 g/t Au from 225.0 metres Including 5.0 metres @ 13.08 g/t Au from 234.7 metres |
Five drill holes were completed for a total of 1,686.5 metres in the
| SW-20-324 | 21.7 metres @ 6.09 g/t Au from 226.0 metres Including 3.0 metres @ 12.93 g/t Au from 238.0 metres |
Sarytor Deposit (Area)
In the second quarter, drilling was not conducted at the Sarytor area, but results were obtained for the hole drilled in the first quarter. Significant intervals are shown below.
| SR-20-244 | 66.4 metres @ 2.05 g/t Au from 262.3 metres Including 9.9 metres @ 4.77 g/t Au from 285.6 metres |
Northeast Deposit (Area)
In the Northeast area, one diamond drill hole was completed during this quarter and results were obtained for previously completed reverse circulation (RC) drilling.
A few broad and low-grade intervals of sulfide and oxide mineralization were intersected. Oxide mineralization was identified in the northwestern part of the area, along the tectonic mélange zone.
Muzdusuu Area
Four diamond drill holes were completed in the Muzdusuu Area for a total of 1,040 metres. Results were also obtained for holes completed in the first quarter. Drilling in the Muzdusuu Area (outside
Hole DM2067 has tested inferred dispersed gold mineralization target in the Tertiary sediments (Parking Lot target) and intersected broad interval of a low-grade mineralization.
Significant intervals are shown below.
| DM2059 | 68.8 metres @ 1.38 g/t Au from 120.7 metres Including 31.0m @ 2.75 g/t Au from 136.0 metres |
| DM2062 | 57.3 metres @ 1.02 g/t Au from 96.2 metres Including 25.2m @ 2.06 g/t Au from 127.6 metres |
| DM2067 | 234.6 metres @ 0.20 g/t Au from 78.6 metres Including 31.0m @ 0.39 g/t Au from 147.6 metres |
The above mineralized intercepts were calculated using a cut-off grade of 1.0 g/t Au for sulfide and 0.1 g/t Au for oxide mineralization, minimum interval of 4.0 metres and a maximum internal dilution interval of 5.0 metres. The true widths for sulfide mineralized intervals reported represent approximately 70 to 95% of the stated down hole interval. Significant assay intervals reported for oxide mineralization represent apparent widths due to the uncertainty of the nature of the mineralization at the time of reporting. Drill collar locations and associated graphics are available at the following link: http://ml.globenewswire.com/Resource/Download/8e9ad544-6c3b-4ea5-b386-8e57ddd0746d
A full listing of the drill results, drill hole locations and plan map (including the azimuth, dip of drill holes, and depth of the sample intervals) for the
The 2020 planned drilling program at
Saddle/66 Gap zone (In-Pit)
DDH 20-1237 and 20-1238 tested for an extension of mineralization into a gap in known reserves between the Saddle and 66 zones; and a deep geophysical target. DDH 20-1237 was abandoned at 26.8 metres for technical reasons. Significant pyrite mineralization in both drill holes is related to dykes (monzonite and trachyte) proximal to faults. The deep interval in 20-1238 was intersected in the immediate footwall of
| DDH 20-1237 | 17.1 metres @ 0.62 g/t Au, 0.10% Copper (“Cu”) from 9.8 metres including 6.7 metres @ 1.07 g/t Au, 0.17% Cu from 20.1 metres |
| DDH 20-1238 | 16.0 metres @ 1.19 g/t Au, 0.03% Cu from 82.0 metres including 3.6 metres @ 4.79 g/t Au, 0.05% Cu from 83.5 metres 76.1 metres @ 0.81 g/t Au, 0.03% Cu from 440.0 metres including 13.2 metres @ 1.57 g/t Au, 0.07% Cu from 449.8 metres and 2.0 metres @ 3.50 g/t Au, 0.05% Cu from 489.0 metres and 2.0 metres @ 3.20 g/t Au, 0.08% Cu from 496.8 metres and 2.0 metres @ 4.57 g/t Au, 0.02% Cu from 510.0 metres 13.0 metres @ 2.17 g/t Au, 0.02% Cu from 524.0 metres including 11.5 metres @ 2.41 g/t Au, 0.02% Cu from 524.0 metres. |
The above mineralized intercepts were calculated using a cut-off grade of 0.1 g/t Au and a maximum internal dilution interval of 4 metres. Significant assay intervals reported represent apparent widths due to the undefined geometry of mineralization in this zone, relationship between fault blocks, and conceptual nature of the exploration target. Drill collar locations and associated graphics are available at the following link: http://ml.globenewswire.com/Resource/Download/8e9ad544-6c3b-4ea5-b386-8e57ddd0746d
Greenfield exploration (MAX project)
The 2020 greenfield Phase-1 drilling program was completed in the second quarter of 2020 at the Max project. The Max project consists of a block of 12 mineral claims (4,869 ha) under option from
A full listing of the drill results, drill hole locations and plan map (including the azimuth, dip of drill holes, and depth of the sample intervals) for the
Öksüt Mine
The 2020 planned drilling program at Öksüt includes 20,000 metres of diamond drilling, focused on near pit resource expansion and other oxide gold targets. The 2020 diamond drilling program has been designed to:
- expand the oxide gold resources around the known deposits at Keltepe and Güneytepe as well as at Keltepe North and Keltepe North-West,
- further test the oxide gold potential at Yelibelen, Büyüktepe, Boztepe and other targets,
- further delineate the supergene copper mineralization at depth, and test other deeper targets.
Drilling, which commenced towards the end of the second quarter of 2020 with one exploration hole being completed for 246 metres at the periphery of Güneytepe, will continue into the third quarter of 2020.
The 2020 planned drilling program has not been impacted by the COVID-19 preventive measures at the Öksüt mine site.
Assay results have been received for the completed drill hole. The highlights are:
| ODD0391 | 9.6 metres @ 0.29 g/t Au from 81.1 metres 115.8 metres @ 0.60 g/t Au from 95.8 metres including 18.6 metres @ 1.28 g/t Au from 129.4 metres and 6.7 metres @ 1.01 g/t Au from 169.6 metres |
The above mineralized intercepts were calculated using a cut-off grade of 0.2 g/t Au and a maximum internal dilution interval of 5 metres. The true widths of the mineralized intervals reported represent approximately 60 to 90% of the stated downhole interval. Drill collar locations and associated graphics are available at the following link: http://ml.globenewswire.com/Resource/Download/8e9ad544-6c3b-4ea5-b386-8e57ddd0746d
A full listing of the drill results, drill hole locations and plan map (including the azimuth, dip of drill holes, and depth of the sample intervals) for the Öksüt
The 2020 Kemess brownfield drilling program is focused on the Kemess North Trend and comprises three drill holes (2,700 metres) at the Nugget historic resource to test for mineralization up-dip of the 2019 drilling and up to three drill holes (2,000 metres) at the Kemess East resource to test for an extension of known mineralization. Drilling at Kemess East will attempt to reuse and extend 2017 drill holes, or alternatively, a single drill hole (2,000 metres) may be drilled from surface. In late June, crews mobilized to site and began preparations, but no drill core was produced. The program is expected to run until late August.
Other Projects
During the second quarter of 2020, greenfield exploration programs targeting gold and copper were ongoing in
Qualified Person & QA/QC – Exploration
Exploration information and related scientific and technical information in this document regarding the
Exploration information and related scientific and technical information in this document regarding the
Exploration information and related scientific and technical information in this document regarding the Öksüt
About Centerra
Conference Call
Centerra invites you to join its 2020 second quarter conference call on
For more information:
Vice President, Investor Relations
(416) 204-1953
john.pearson@centerragold.com
Additional information on Centerra is available on the Company’s web site at www.centerragold.com and at SEDAR at www.sedar.com.
A PDF accompanying this announcement is available at http://ml.globenewswire.com/Resource/Download/1ec1438d-f0e7-410c-b105-bea826b46ced
Management’s Discussion and Analysis
For the Period Ended
This Management Discussion and Analysis (“MD&A”) has been prepared as of
Caution Regarding Forward-Looking Information
Information contained in this document which are not statements of historical facts, and the documents incorporated by reference herein, may be “forward-looking information” for the purposes of Canadian securities laws. Such forward-looking information involves risks, uncertainties and other factors that could cause actual results, performance, prospects and opportunities to differ materially from those expressed or implied by such forward looking information. The words “believe”, “expect”, “anticipate”, “contemplate”, “plan”, “intends”, “continue”, “budget”, “estimate”, “may”, “will”, “schedule”, “understand” and similar expressions identify forward-looking information. These forward-looking statements relate to, among other things: the Company’s expectations regarding timing for an updated Kumtor Technical Report and the potential for expanding the Kumtor life of mine; possible impacts to its operations relating to COVID-19; planned exploration activities for the remainder of 2020; the achievement of 2020 guidance and the Company’s expectations at each of our operating sites; the Company’s expectations regarding having sufficient liquidity for 2020; the Company’s expectations regarding accessing water at its
Forward-looking information is necessarily based upon a number of estimates and assumptions that, while considered reasonable by Centerra, are inherently subject to significant technical, political, business, economic and competitive uncertainties and contingencies. Known and unknown factors could cause actual results to differ materially from those projected in the forward-looking information. Factors and assumptions that could cause actual results or events to differ materially from current expectations include, among other things: (A) strategic, legal, planning and other risks, including: political risks associated with the Company’s operations in the
There can be no assurances that forward-looking information and statements will prove to be accurate, as many factors and future events, both known and unknown could cause actual results, performance or achievements to vary or differ materially from the results, performance or achievements that are or may be expressed or implied by such forward-looking statements contained herein or incorporated by reference. Accordingly, all such factors should be considered carefully when making decisions with respect to Centerra, and prospective investors should not place undue reliance on forward looking information. Forward-looking information is as of
TABLE OF CONTENTS
| Overview | 14 |
| Consolidated Financial and Operational Highlights | 15 |
| Overview of Consolidated Results | 16 |
| 2020 Outlook | 17 |
| Financial Performance | 20 |
| Balance Sheet Review | 23 |
| Cash Flow Review | 24 |
| Market Conditions | 25 |
| Financial Instruments | 28 |
| Operating Mines and Facilities | 28 |
| Pre-Development Projects | 44 |
| Quarterly Results – Previous Eight Quarters | 45 |
| Contingencies | 46 |
| Accounting Estimates, Policies and Changes | 47 |
| Disclosure Controls and Procedures and Internal Control Over Financial Reporting | 48 |
| Non-GAAP Measures | 48 |
| Qualified Person & QA/QC – Production, Mineral Reserves and Mineral Resources | 53 |
Overview
Centerra is a Canadian-based gold mining company focused on operating, developing, exploring and acquiring gold properties worldwide and is one of the largest Western-based gold producers in
As of
| Current | Property | |||
| Entity | Property - Location | Status | Ownership | |
| Operation | 100 | % | ||
| Operation | 100 | % | ||
| Öksüt Madencilik A.S. (“OMAS”) | Öksüt Mine - | Operation | 100 | % |
| Operation | 100 | % | ||
| Pre-development | 100 | % | ||
| Greenstone Gold Property - | Pre-development | 50 | % | |
States | Care and Maintenance | 100 | % | |
| Care and Maintenance | 75 | % | ||
Centerra’s common shares are listed for trading on the
The Company reports the results of its operations in
Consolidated Financial and Operational Highlights
| Unaudited ($ millions, except as noted) | Three months ended | Six months ended | ||||||||
| Financial Highlights | 2020 | 2019 | % Change | 2020 | 2019 | % Change | ||||
| Revenue | $ | 412.7 | $ | 340.5 | 21% | $ | 786.7 | $ | 674.5 | 17% |
| Production costs | 141.9 | 182.7 | (22%) | 306.6 | 354.4 | (14%) | ||||
| Depreciation, depletion and amortization | 85.4 | 59.0 | 45% | 158.5 | 113.4 | 40% | ||||
| Earnings from mine operations | 185.3 | 98.9 | 87% | 315.0 | 206.7 | 52% | ||||
| Net earnings | $ | 80.7 | $ | 33.4 | 142% | $ | 100.8 | $ | 83.8 | 20% |
| Adjusting items | ||||||||||
| - ARO revaluation at sites on care and maintenance | 17.1 | - | 43.5 | - | ||||||
| Adjusted net earnings (3) | $ | 97.8 | $ | 33.4 | 193% | $ | 144.3 | $ | 83.8 | 72% |
| Cash provided by operations | 268.1 | 91.0 | 195% | 389.2 | 209.8 | 86% | ||||
| Cash provided by operations before changes in working capital | 216.1 | 101.4 | 113% | 359.4 | 215.6 | 67% | ||||
| Free cash flow (3) | 169.1 | 30.7 | 451% | 245.9 | 87.7 | 180% | ||||
| Capital expenditures - sustaining | 33.1 | 20.8 | 59% | 47.5 | 40.6 | 17% | ||||
| Capital expenditures - growth and development projects | 18.1 | 38.2 | (53%) | 32.2 | 63.7 | (49%) | ||||
| Capital expenditures - stripping | 46.8 | 15.6 | 200% | 86.7 | 38.4 | 126% | ||||
| Total assets | $ | 2,769.3 | $ | 2,887.9 | (4%) | $ | 2,769.3 | $ | 2,887.9 | (4%) |
| Long-term debt and lease obligations | 15.5 | 90.6 | (83%) | 15.5 | 90.6 | (83%) | ||||
| Cash, cash equivalents and restricted cash (5) | 214.2 | 167.5 | 28% | 214.2 | 167.5 | 28% | ||||
| Per Share Data | ||||||||||
| Earnings per common share - $ basic (1) | $ | 0.27 | $ | 0.11 | 145% | $ | 0.34 | $ | 0.29 | 17% |
| Adjusted net earnings per common share - $ basic (1)(3) | $ | 0.33 | $ | 0.11 | 200% | $ | 0.49 | $ | 0.29 | 69% |
| Per Ounce Data (except as noted) | ||||||||||
| Average gold spot price ($/oz) (2) | 1,714 | 1,309 | 31% | 1,648 | 1,306 | 26% | ||||
| Average realized gold price ($/oz) (3)(4) | 1,620 | 1,237 | 31% | 1,555 | 1,232 | 26% | ||||
| Average copper spot price ($/lb) (2) | 2.42 | 2.78 | (13%) | 2.50 | 2.79 | (10%) | ||||
| Average realized copper price ($/lb) (3)(4) | 2.06 | 1.95 | 6% | 1.83 | 2.16 | (15%) | ||||
| Operating Highlights | ||||||||||
| Gold produced (oz's) | 219,692 | 199,578 | 10% | 410,165 | 383,140 | 7% | ||||
| Gold sold (oz's) | 217,539 | 198,287 | 10% | 420,797 | 394,738 | 7% | ||||
| Payable Copper Produced (000's lbs) | 19,064 | 20,397 | (7%) | 39,136 | 31,837 | 23% | ||||
| Copper Sales (000's payable lbs) | 19,352 | 18,700 | 3% | 39,776 | 31,222 | 27% | ||||
| Unit Costs | ||||||||||
| Production costs per ounce of gold sold (4) | $ | 410 | $ | 479 | (14%) | $ | 417 | $ | 468 | (11%) |
| Gold - All-in sustaining costs on a by-product basis ($/oz sold) (3)(4) | $ | 804 | $ | 716 | 12% | $ | 760 | $ | 693 | 10% |
| Gold - All-in sustaining costs on a by-product basis (including taxes) ($/oz sold) (3) (4) | $ | 999 | $ | 861 | 16% | $ | 947 | $ | 837 | 13% |
| Gold - All-in sustaining costs on a co-product basis (before taxes) – ($/oz sold) (3)(4) | $ | 860 | $ | 712 | 21% | $ | 790 | $ | 705 | 12% |
| Production costs per pound of copper sold (4) | $ | 1.20 | $ | 1.65 | (27%) | $ | 1.27 | $ | 1.65 | (23%) |
| Copper - All-in sustaining costs on a co-product basis (before taxes) – ($/pound sold) (3)(4) | $ | 1.44 | $ | 1.97 | (27%) | $ | 1.46 | $ | 2.01 | (27%) |
(1) As at
(2) Average for the period as reported by the
(3) Non-GAAP measure. See discussion under “Non-GAAP Measures”.
(4) Combines streamed and unstreamed amounts.
(5 )Includes restricted cash of
Overview of Consolidated Results
Second Quarter 2020 compared to Second Quarter 2019
The Company recognized net earnings of
Cash provided by operations was
Safety and Environment
Centerra incurred five reportable injuries in the second quarter of 2020, including two lost time injuries, two medical aid injuries and one restricted work injury.
Centerra has implemented a number of proactive measures to prevent the spread of COVID-19 and ensure the safety of its employees, contractors, communities and other stakeholders.
There were no reportable releases to the environment in the second quarter of 2020.
First Half 2020 compared to First Half 2019
The Company recognized net earnings of
Cash provided by operations was
2020 Outlook
Centerra is maintaining its 2020 guidance for gold and copper production, and all-in sustaining costs per ounce soldNG. At the Kumtor operation, although fewer waste tonnes were mined due to reduced workforce on site, the mill operations continue as normal as we process materials from stockpiles throughout 2020 as planned.
Centerra is revising its 2020 guidance for capital spending, excluding capitalized stripping, to
Despite its best efforts, the Company notes that COVID-19 has the potential to significantly disrupt Centerra’s operations going forward and affect the Company’s future operating results. Among other things, COVID-19 has the potential to cause significant illness in the workforce, temporarily shut down mining, processing and other operations, and disrupt supply chains as well as rail and shipping networks used to deliver products to customers. While Centerra has taken and will continue to take measures to mitigate such risks, the global effects of COVID-19 are rapidly evolving and cannot be predicted.
2020 Production, Sales and Cost Guidance
Consolidated gold sales in the first half of 2020 was 420,797 ounces, slightly higher than 50% of the full year guidance of 740,000 to 820,000 ounces, consistent with the expectation that sales from the
In the first half of 2020, production costs per ounce of gold sold was
In the second half of 2020 the Company expects that Kumtor will process lower grade material than in the first half of 2020 but also expects an increase in production from the Öksüt Mine as it continues to ramp up production.
Centerra’s production forecast for the full year 2020 is maintained as follows:
| Units | Kumtor | Mount Milligan(1) | Öksüt | Centerra | |
| Gold | |||||
| Unstreamed Gold Payable Production guidance | (Koz) | 520-560 | 91-104 | 80-100 | 691-764 |
| Streamed Gold Payable Production guidance(1) | (Koz) | - | 49-56 | - | 49-56 |
| Total Gold Payable Production guidance(2) | (Koz) | 520-560 | 140-160 | 80-100 | 740-820 |
| First Half 2020 Gold Payable Production | (Koz) | 326 | 69 | 15 | 410 |
| Copper | |||||
| Unstreamed Copper Payable Production guidance | (Mlb) | - | 65-73 | - | 65-73 |
| Streamed Copper Payable Production guidance(1) | (Mlb) | - | 15-17 | - | 15-17 |
| Total Copper Payable Production guidance(3) | (Mlb) | - | 80-90 | - | 80-90 |
| First Half 2020 Copper Payable Production | (Koz) | - | 39 | - | 39 |
(1) The Mount Milligan Streaming Arrangement entitles Royal Gold to 35% and 18.75% of gold and copper sales, respectively, from the
(2) Gold production assumes recoveries of 82.4% at Kumtor, 64% at
(3) Copper production assumes 81.9% recovery for copper at
Centerra’s 2020 all-in sustaining costs per ounce soldNG (“AISC”) guidance calculated on a by-product basis is maintained as follows:
| Units | Kumtor | Öksüt | Centerra(2) | ||||||
| All-in sustaining costs on a by-product basis guidance(1)(2) | ($/oz) | ||||||||
| First half of 2020 All-in sustaining costs on a by- product basis (1)(2) | ($/oz) | ||||||||
(1) All-in sustaining costs on a by-product per ounce sold basis are non-GAAP measures and are discussed under “Non-GAAP Measures”.
(2)
2020 Capital Spending
Centerra’s 2020 guidance for capital spending, excluding capitalized stripping, has been revised to
Growth and sustaining capital spent in the first half of 2020 was
Projected capital expenditures include:
| Capitalized | Sustaining | Growth | ||||||
| Projects ($ millions) | Stripping | Capital | Capital | Total | ||||
| 215 | 68 | 18 | 301 | |||||
| - | 55 | - | 55 | |||||
| Öksüt Mine(1) | 8 | - | 29 | 37 | ||||
| - | - | 13 | 13 | |||||
| Other(2) | - | 9 | - | 9 | ||||
| Consolidated Total | $ | 223 | $ | 132 | $ | 60 | $ | 415 |
(1) Capitalized stripping includes a cash component of
(2)
Material Assumptions
The Company has not modified the material assumptions used to set its initial 2020 guidance. The Company notes that there has been positive movement in current market prices of gold and copper, as well as diesel prices and foreign exchange rates. Those movements have been partially offset by inflationary cost pressures in both the
Material assumptions or factors used to forecast production and costs for 2020 include the following:
- a gold price of
$1,350 per ounce, - a copper price of
$2.60 per pound, - a molybdenum price of
$10.75 per pound. - exchange rates:
º $1USD:$1.30 Canadian dollar ,
º $1USD:69.50 Kyrgyz som,
º $1USD:5.50 Turkish lira,
º $1USD:0.85 Euro . - diesel fuel price assumption:
º$0.50 /litre at Kumtor,
º$0.81 /litre (CAD$1.06 /litre) atMount Milligan .
Material assumptions used in forecasting production and costs for 2020 can be found under the heading “Caution Regarding Forward-Looking Information” in this document. Production, cost and capital forecasts for 2020 are forward-looking information and are based on key assumptions and subject to material risk factors that could cause actual results to differ materially and which are discussed under the heading “Risks That Can Affect Our Business” in the Company’s most recent Annual Information Form.
Sensitivities
Centerra’s revenues, earnings and cash flows for the second half of 2020 are sensitive to changes in certain key inputs or currencies. The Company has estimated the impact of any such changes on revenues, net earnings and cash from operations.
| Impact on ($ millions) | Impact on ($ per ounce sold) | ||||||||
| Production Costs & Taxes | Capital Costs | Financing Costs | Revenues | Cash flows | Net Earnings (after tax) | AISC(2)(3) on by-product basis | |||
| Gold price | 2.2 -2.7 | - | 0.7 - 0.8 | 15.4 - 19.1 | 12.5 - 15.6 | 12.5 - 15.6 | 0.41 - 0.43 | ||
| Copper price | 10 | % | 2.4 - 3.0 | - | 0.3 - 0.4 | 8.5 - 10.7 | 5.8 - 7.3 | 5.8 - 7.3 | 21.7 - 26.9 |
| Diesel fuel(4) | 10 | % | 2.4- 3.0 | - | - | - | 2.4 - 3.0 | 2.4 - 3.0 | 6.5 - 8.1 |
| Kyrgyz som(1) | 1 som | 0.8 - 1.0 | - | - | - | 0.8 - 1.0 | 0.8 - 1.0 | 2.1 - 2.6 | |
| Canadian dollar(1)(4) | 4.3 - 5.0 | 2.1 - 2.4 | - | - | 6.4 - 7.4 | 4.3 - 5.0 | 16.7 - 20.7 | ||
| Turkish lira(1) | 2.0 - 2.5 | 0.8 - 1.1 | - | - | 2.8 - 3.6 | 2.0 - 2.5 | 7.8 - 9.7 | ||
(1) Appreciation of currency against the
(2) Non-GAAP measure. See discussion under “Non-GAAP Measures”.
(3) AISC is calculated over the second half of the year ounces sold forecast.
(4) Includes the effect of hedging programs.
Financial Performance
Second Quarter 2020 compared to Second Quarter 2019
Revenue:
Revenue increased to
Production:
Gold production in the second quarter of 2020 was 219,692 ounces compared to 199,578 ounces for the same prior year period. Gold production at Kumtor was 173,245 ounces in the second quarter of 2020,
Copper production at
Production costs per ounce of gold sold:
Production costs per ounce of gold sold decreased in the second quarter of 2020 to
All-in Sustaining CostsNG:
Centerra’s all-in sustaining costs on a by-product basis per ounce of gold soldNG, which excludes revenue-based tax and income tax, increased to
Exploration:
Exploration expenditures in the second quarter of 2020 were
Financing costs:
Financing costs in the second quarter of 2020 were
Corporate administration:
Corporate administration costs were
First Half 2020 compared to First Half 2019
Revenue:
Revenue increased to
Production:
Gold production in the first half of 2020 was 410,165 ounces compared to 383,140 ounces for the same prior year period. Gold production at Kumtor was 325,551 ounces in the first half of 2020,
Copper production at
Production costs per ounce of gold sold:
Production costs per ounce of gold sold decreased in the first half of 2020 to
All-in Sustaining CostsNG:
Centerra’s all-in sustaining costs on a by-product basis per ounce of gold soldNG, which excludes revenue-based tax and income tax, increased to
Exploration:
Exploration expenditures in the first half of 2020 were
Financing costs:
Financing costs in the first half of 2020 were
Corporate administration:
Corporate administration costs were
Balance Sheet Review
| $ millions | As at | ||
| %Change | |||
| Consolidated: | |||
| Cash | 212.2 | 42.7 | 397% |
| Inventories | 689.5 | 774.1 | (11%) |
| Current assets | 90.9 | 115.9 | (22%) |
| Property, plant and equipment | 1,706.3 | 1,669.5 | 2% |
| Non-current assets | 70.4 | 99.5 | (29%) |
| Total Assets | 2,769.3 | 2,701.7 | 3% |
| Current liabilities | 252.7 | 244.8 | 3% |
| Non-current Debt | - | 70.0 | (100%) |
| Provision for reclamation | 311.3 | 265.0 | 17% |
| Non-current liabilities | 53.6 | 56.1 | (4%) |
| Total Liabilities | 617.6 | 635.9 | (3%) |
| Total Equity | 2,151.7 | 2,065.8 | 4% |
| Total Liabilities and Equity | 2,769.3 | 2,701.7 | 3% |
Cash
Cash at
Inventory
Total inventory as at
As at
Property, Plant and Equipment
The book value of property, plant and equipment as at
Asset Retirement Obligations
The asset retirement obligations of
In 1998, a reclamation trust fund was established to cover the future costs of reclamation, net of salvage values at the
Debt
Total bank debt as at
In the first half of 2020, the Company repaid the outstanding balance of
Liquidity
The Company believes its cash on hand, cash flow from the Company’s Kumtor,
Cash Flow Review
Cash provided by operating activities
Cash provided by operations increased by 195% in the second quarter of 2020, compared to the second quarter of 2019 as a result of higher revenue and an increase in cash generated from lower working capital levels.
Cash provided by operations increased by 86% in the first half of 2020, compared to the first half of 2019 as a result of higher revenue and an increase in cash generated from lower working capital levels.
Cash used in investing activities
Cash used in investing activities increased by 58% in the second quarter 2020, compared to the second quarter 2019, primarily due to the increase in capitalized stripping at Kumtor.
Cash used in investing activities decreased by 4% in the first half of 2020, compared to the first half of 2019, primarily due to the release of restricted cash upon repayment and cancellation of the Öksüt project financing facility in the first quarter of 2020.
Cash used in financing activities
Cash used in financing activities increased by 117% in the second quarter of 2020 when compared to the second quarter of 2019. The increase was mainly due to the repayment of the Company’s revolving credit facility on
Cash used in financing activities increased by 4% in the first half of 2020 when compared to the first half of 2019. The increase was primarily due the dividends paid in the first half of 2020, partially offset by higher repayments on the Company’s revolving credit facility in the first half of 2019.
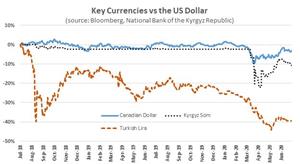
Market Conditions
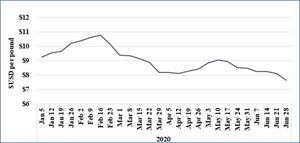
Gold Price
During the second quarter of 2020, the spot gold price fluctuated between a low of
The average spot gold price in the first half of 2020 was
Copper Price
The average spot copper price in the second quarter of 2020 was
The average spot copper price in the first half of 2020 was
Molybdenum Price
The average molybdenum price in the second quarter of 2020 was
The average molybdenum price in the first half of 2020 was
Foreign Exchange
The Company receives its revenue through the sale of gold, copper and molybdenum in
A photo accompanying this announcement is available at https://www.globenewswire.com/NewsRoom/AttachmentNg/408b4c76-c33d-4c67-ac1f-5f08c768996c
USD to CAD
During the second quarter of 2020, the spot price of the exchange rate of the
The average
The Canadian dollar as at
In the second quarter and first half of 2020, Centerra’s Canadian dollar hedging program resulted in a
USD to Kyrgyz Som
During the second quarter of 2020, the spot price of the
The average
The Kyrgyz som as at
USD to Turkish Lira
The average
Diesel Fuel Prices
Fuel costs represent a significant cost component for Centerra’s mining operations, representing 11% of production costs. Prices for Kumtor diesel fuel in the second quarter and first half of 2020 generally reflected the price movements of Brent crude oil. The average purchase price for diesel fuel for Kumtor in the second quarter and first half of 2020 was
According to the
The Company utilizes its diesel hedging program in order to manage its exposure to adverse fluctuations in diesel fuel prices, see “Financial Instruments”. In the second quarter of 2020, Centerra’s diesel hedging program resulted in a
Financial Instruments
The Company seeks to manage its exposure to fluctuations in diesel fuel prices, commodity prices and foreign exchange rates by entering into derivative financial instruments from time-to-time.
The hedge positions for each of these programs as at
| Settlements | As at | ||||||||
| Program | Instrument | Unit | Average strike price | Type | 2020 | 2021 | 2022 | Total position (4) | Fair value($'000's) |
| FX Hedges | |||||||||
| USD/CAD zero-cost collars(3) | CAD | 1.33/1.39 | Fixed | 96.0 million | 184.8 million | 90.0 million | 370.8 million | (788) | |
| USD/CAD forward contracts(2) | CAD | 1.39 | Fixed | 90.0 million | 96.0 million | - | 186.0 million | 2,843 | |
| Fuel Hedges | |||||||||
| Brent Crude Oil zero-cost collars(1) | Barrels | Fixed | 98,790 | 74,592 | 45,000 | 218,382 | (1,762) | ||
| Brent Crude Oil swap contracts(2) | Barrels | Fixed | 16,000 | 203,925 | 6,000 | 225,925 | 235 | ||
| ULSD zero-cost collars(1) | Barrels | Fixed | 146,440 | 42,116 | 60,000 | 248,556 | (3,740) | ||
| ULSD swap contracts(2) | Barrels | Fixed | 66,000 | 213,255 | 6,000 | 285,255 | 322 | ||
| Gold/Copper Hedges (Royal Gold deliverables): | |||||||||
| Gold forward contracts(2) | Ounces | N/A(4) | Float | 17,004 | - | - | 17,004 | 1,640 | |
| Copper forward contracts(2) | Pounds | N/A(4) | Float | 4.9 million | - | - | 4.9 million | 1,370 | |
(1) Under the fuel zero-cost collars, the Company retains the right to buy fuel barrels at the contract’s ‘ceiling’ price if the market price was to exceed this price upon contract expiration, while requiring the Company to buy fuel barrels at the ‘floor’ price if the market price fell below this price upon expiration. At the end of each contract there is no exchange of the underlying item and it is financially settled.
(2) Under the swap and forward contracts, the Company ‘buy’ and ‘sell’ metals, currencies and commodities, at a specified price at a certain future date. The Company retains the right for these contracts to be cash or physically settled.
(3) Under the currency zero-cost collars, the Company retains the right to buy foreign currency at the contract’s ‘floor’ price if the market price was to fall below this price upon contract expiration, while requiring it to buy foreign currency at the ‘ceiling’ price if the market price was to exceed this price upon expiration.
(4) Royal Gold hedging program with a market price determined on closing of the contract.
Centerra does not enter into off-balance sheet arrangements with special purpose entities in the normal course of its business, nor does it have any unconsolidated affiliates.
Operating Mines and Facilities
The Kumtor open pit mine, located in the
An updated Kumtor technical report for the
During the second quarter, the final waste rock dump design was completed and submitted for Government approval to re-utilize the
COVID-19 update
Kumtor continues to implement mitigation controls and health & safety precautions at the mine site to contain the spread of COVID-19. While Kumtor’s operations in the second quarter were not affected, the Company has begun to notice an effect on the availability of Kumtor’s workforce due to a greater rate of COVID-19 infections and other illnesses in the
As Kumtor is an isolated mine site with an on-site camp, all employees and contractors are required to undergo comprehensive testing and remain in an offsite quarantine facility prior to traveling to the mine site. As of
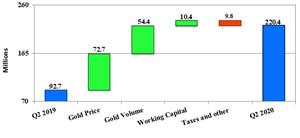
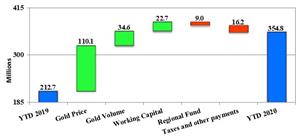
Kumtor Operating Results
| Unaudited ($ millions, except as noted) | Three months ended | Six months ended | ||||||||||||||
| Financial Highlights: | 2020 | 2019 | % Change | 2020 | 2019 | % Change | ||||||||||
| Revenue | $ | 286.4 | $ | 197.7 | 45% | $ | 535.3 | $ | 392.6 | 36% | ||||||
| Production costs | 54.7 | 60.3 | (9%) | 106.2 | 114.3 | (7%) | ||||||||||
| Depreciation, depletion and amortization | 64.9 | 43.6 | 49% | 118.5 | 84.6 | 40% | ||||||||||
| Earnings from mine operations | $ | 166.8 | $ | 93.8 | 78% | $ | 303.9 | $ | 193.7 | 57% | ||||||
| Cash provided by mine operations | 220.4 | 92.7 | 138% | 354.8 | 212.7 | 67% | ||||||||||
| Cash provided by mine operations before changes in working capital | 187.0 | 105.9 | 77% | 329.7 | 215.7 | 53% | ||||||||||
| Free cash flow (1) | 156.9 | 65.3 | 140% | 252.6 | 156.7 | 61% | ||||||||||
| Operating Highlights: | ||||||||||||||||
| Tonnes mined (000's) | 23,077 | 39,949 | (42%) | 43,075 | 89,143 | (52%) | ||||||||||
| Tonnes ore mined (000's) | 14 | 2,630 | (99%) | 585 | 4,507 | (87%) | ||||||||||
| Average mining grade (g/t) | 1.66 | 1.45 | 14% | 7.71 | 1.74 | 344% | ||||||||||
| Tonnes processed (000's) | 1,568 | 1,575 | (0%) | 3,170 | 3,151 | 1% | ||||||||||
| Average process plant head grade (g/t) | 3.95 | 3.48 | 14% | 3.74 | 3.60 | 4% | ||||||||||
| Process plant Recovery (%) | 84.1% | 82.3% | 2% | 83.9% | 82.1% | 2% | ||||||||||
| Mining costs - total ($/t mined material) | 1.64 | 1.32 | 24% | 1.70 | 1.16 | 46% | ||||||||||
| Processing costs ($/t milled material) | 11.17 | 11.51 | (3%) | 11.03 | 11.22 | (2%) | ||||||||||
| Gold produced (ounces) | 173,245 | 151,065 | 15% | 325,551 | 301,373 | 8% | ||||||||||
| Gold sold (ounces) | 170,350 | 153,307 | 11% | 330,440 | 303,574 | 9% | ||||||||||
| Average realized gold price ($/oz sold) (1) | 1,681 | 1,290 | 30% | 1,620 | 1,293 | 25% | ||||||||||
| Capital Expenditures - sustaining | 24.5 | 11.3 | 117% | 33.0 | 20.3 | 63% | ||||||||||
| Capital Expenditures - growth | 3.3 | 4.5 | (27%) | 4.0 | 6.5 | (38%) | ||||||||||
| Capital Expenditures - stripping - cash | 35.0 | 12.1 | 190% | 65.0 | 29.4 | 121% | ||||||||||
| Capital Expenditures - stripping - non-cash | 10.6 | 3.5 | 204% | 20.6 | 9.0 | 128% | ||||||||||
| Capital Expenditures - total | 73.5 | 31.4 | 134% | 122.5 | 65.2 | 88% | ||||||||||
| Unit Costs: | ||||||||||||||||
| Production costs per ounce of gold sold | $ | 321 | $ | 393 | (18%) | $ | 321 | $ | 376 | (15%) | ||||||
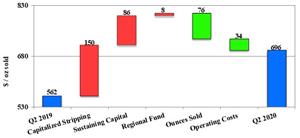
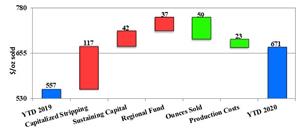
| Gold - All-in sustaining costs on a by-product basis ($/oz sold) (1) | $ | 696 | $ | 562 | 24% | $ | 671 | $ | 557 | 20% | ||||||
| Gold - All-in sustaining costs on a by-product basis - including taxes ($/oz sold) (1) | $ | 933 | $ | 744 | 25% | $ | 900 | $ | 739 | 22% | ||||||
(1) Non-GAAP measure. See discussion under “Non-GAAP Measures”
Second Quarter 2020 compared to Second Quarter 2019
For the three months ended
A photo accompanying this announcement is available at https://www.globenewswire.com/NewsRoom/AttachmentNg/8bda1de8-c9af-4cf3-ae7c-337cf5530090
Cash provided by mine operations in the second quarter of 2020 was
During the second quarter of 2020, Kumtor continued stripping and managing the ice from cut-back 20. Tonnes mined were 23.1 million compared to 39.9 million tonnes in the comparative prior year period, representing a decrease of 42%, mainly due to longer haulage distances as a result of the change in waste rock dump location from the
Mining costs per tonne were
In the second quarter of 2020, Kumtor produced 173,245 ounces of gold from previously mined on-surface stockpiled ore, compared to 151,065 ounces of gold in the same prior year period. The increase in the current quarter was primarily due to higher mill head grade and higher gold recovery. During the second quarter of 2020, Kumtor’s average process plant head grade was 3.95 g/t with a recovery of 84.1% compared to 3.48 g/t and a recovery of 82.3% in the second quarter of 2019.
Processing costs per tonne were
Kumtor’s production costs per ounce of gold sold were
A photo accompanying this announcement is available at https://www.globenewswire.com/NewsRoom/AttachmentNg/c634e568-af08-4cef-bdc8-e03195dcf1f2
Kumtor’s all-in sustaining costs on a by-product basis per ounce soldNG, which excludes revenue-based tax, were
Including revenue-based taxes, all-in sustaining costs on a by-product basis per ounce soldNG were
First Half 2020 compared to First Half 2019
For the six months ended
A photo accompanying this announcement is available at https://www.globenewswire.com/NewsRoom/AttachmentNg/675a5b85-9c7c-420d-97cb-0b226f4d4f25
Cash provided by mine operations in the first half of 2020 was
During the first half of 2020, mining operations restarted in January following the Lysii waste rock dump incident, Kumtor finished mining cut-back 19 West and the
Mining costs per tonne were
In the first half of 2020, Kumtor produced 325,551 ounces of gold from previously mined on-surface stockpiled ore, compared to 301,373 ounces of gold in the same prior year period. The increase was primarily due to higher mill head grade, higher gold recovery and more gold produced from carbon fines. During the first half of 2020, Kumtor’s average process plant head grade was 3.74 g/t with a recovery of 83.9% compared to 3.60 g/t and a recovery of 82.1% in the first half of 2019.
Processing costs per tonne were
Kumtor’s production costs per ounce of gold sold were
A photo accompanying this announcement is available at https://www.globenewswire.com/NewsRoom/AttachmentNg/f76cac96-1385-4713-85d3-7eb42b339812
Kumtor’s all-in sustaining costs on a by-product basis per ounce soldNG, which excludes revenue-based tax, were
Including revenue-based taxes, all-in sustaining costs on a by-product basis per ounce soldNG were
Water Update
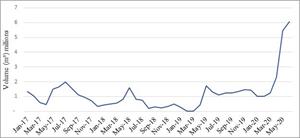
Stored water inventory at
A photo accompanying this announcement is available at https://www.globenewswire.com/NewsRoom/AttachmentNg/d9b1618b-1be8-4096-88b8-73f0a38c8845
Spring water pumping began in April. Substantial snowpack and a wet spring have led to volumes pumped as of the end of June that exceeded those of the entire 2019 pumping season. In addition, during the second quarter of 2020,
The Company continues to pursue a longer-term solution to its water requirements at
COVID-19
The temporary workforce reduction at
One case of COVID-19 was confirmed onsite in
Mount Milligan Operating Results
| Unaudited ($ millions, except as noted) | Three months ended | Six months ended | ||||||||||||||
| Financial Highlights: | 2020 | 2019 | % Change | 2020 | 2019 | % Change | ||||||||||
| Gold sales | 45.3 | 47.6 | (5%) | 94.3 | 93.9 | 0% | ||||||||||
| Copper sales | 39.8 | 36.4 | 9% | 72.7 | 67.5 | 8% | ||||||||||
| Total Revenues | $ | 85.1 | $ | 84.0 | 1% | $ | 167.0 | $ | 161.4 | 3% | ||||||
| Production costs | 53.0 | 65.6 | (19%) | 113.6 | 122.1 | (7%) | ||||||||||
| Depreciation, depletion and amortization | 18.0 | 14.0 | 28% | 36.0 | 26.3 | 37% | ||||||||||
| Earnings from mine operations | $ | 14.1 | $ | 4.2 | 236% | $ | 17.4 | $ | 13.0 | 34% | ||||||
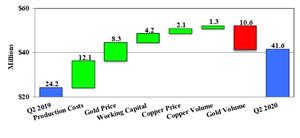
| Cash provided by mine operations | 41.6 | 24.2 | 72% | 68.8 | 36.6 | 88% | ||||||||||
| Cash provided by mine operations before changes in working capital | 29.1 | 11.3 | 158% | 41.1 | 27.8 | 48% | ||||||||||
| Free cash flow(1) | 34.4 | 16.7 | 106% | 56.4 | 18.4 | 207% | ||||||||||
| Operating Highlights: | ||||||||||||||||
| Tonnes mined (000's) | 8,109 | 9,947 | (18%) | 18,998 | 19,252 | (1%) | ||||||||||
| Tonnes ore mined (000's) | 4,140 | 4,426 | (6%) | 8,829 | 6,976 | 27% | ||||||||||
| Tonnes milled (000's) | 4,373 | 4,874 | (10%) | 9,244 | 7,304 | 27% | ||||||||||
| Process plant Head | 0.26% | 0.24% | 6% | 0.26% | 0.25% | 2% | ||||||||||
| Process plant Head | 0.39 | 0.48 | (19%) | 0.38 | 0.53 | (28%) | ||||||||||
| Copper Recovery (%) | 80.8% | 82.3% | (2%) | 78.0% | 82.3% | (5%) | ||||||||||
| Gold Recovery (%) | 66.5% | 66.0% | 1% | 63.1% | 67.6% | (7%) | ||||||||||
| Mining costs - total ($/t mined material) | 1.72 | 2.23 | (23%) | 1.74 | 2.15 | (19%) | ||||||||||
| Processing plant costs - total ($/t milled material) | 5.66 | 6.84 | (17%) | 5.27 | 7.92 | (33%) | ||||||||||
| Concentrate Produced (dmt) | 41,242 | 43,847 | (6%) | 86,329 | 69,658 | 24% | ||||||||||
| Payable Gold Produced (oz) (2) | 35,656 | 48,513 | (27%) | 69,337 | 81,767 | (15%) | ||||||||||
| Payable Copper Produced (000's lbs) (2) | 19,064 | 20,397 | (7%) | 39,136 | 31,837 | 23% | ||||||||||
| Gold Sales (payable oz) (2) | 35,001 | 44,980 | (22%) | 75,354 | 91,164 | (17%) | ||||||||||
| Copper Sales (000's payable lbs) (2) | 19,352 | 18,700 | 3% | 39,776 | 31,222 | 27% | ||||||||||
| Average Realized Price - Gold - combined ($/oz ) (1)(2) | 1,295 | 1,058 | 22% | 1,252 | 1,031 | 21% | ||||||||||
| Average Realized Price - Copper - combined ($/lb) (1)(2) | 2.06 | 1.95 | 6% | 1.83 | 2.16 | (15%) | ||||||||||
| Capital Expenditures - sustaining (1) | 7.1 | 8.9 | (19%) | 12.4 | 19.6 | (37%) | ||||||||||
| Unit Costs: | ||||||||||||||||
| Production costs per ounce of gold sold | $ | 849 | $ | 771 | 10% | $ | 837 | $ | 773 | 8% | ||||||
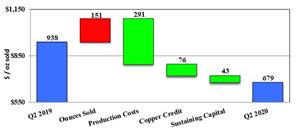
| Gold - All-in Sustaining costs on a by-product basis ($/oz sold) (1) | $ | 679 | $ | 938 | (28%) | $ | 798 | $ | 889 | (10%) | ||||||
| Gold - All-in Sustaining costs on a by-product basis - including taxes ($/oz sold) (1) | $ | 716 | $ | 958 | (25%) | $ | 827 | $ | 908 | (9%) | ||||||
| Gold - All-in Sustaining costs on a co-product basis ($/oz sold) (1) | $ | 1,020 | $ | 925 | 10% | $ | 967 | $ | 942 | 3% | ||||||
| Production costs per pound of copper sold | $ | 1.20 | $ | 1.65 | (27%) | $ | 1.27 | $ | 1.65 | (23%) | ||||||
| Copper - All-in Sustaining costs on a co-product basis ($/lb sold) (1) | $ | 1.44 | $ | 1.97 | (27%) | $ | 1.46 | $ | 2.01 | (27%) | ||||||
(1) Non-GAAP measure. See discussion under “Non-GAAP Measures”
(2)
Second Quarter 2020 compared to Second Quarter 2019
Mount Milligan’s earnings from mine operations was
A photo accompanying this announcement is available at https://www.globenewswire.com/NewsRoom/AttachmentNg/074d5825-7eab-474b-a77e-e90c9fa372b4
Cash provided by mine operations was
During the second quarter of 2020, mining activities were in phases 4, 5 and 8 of the open pit. Total tonnes mined in the second quarter of 2020 was 8.1 million tonnes and total material moved was 9.0 million tonnes. In the comparative quarter of 2019, total tonnes mined was 9.9 million tonnes and total material moved was 10.8 million tonnes. The lower tonnes mined in the second quarter of 2020 was due to the temporary 4-week partial shutdown of the mining operations to mitigate the risk of COVID-19.
Mining costs per tonne were
Total mill throughput was 4.4 million tonnes, averaging 48,056 tonnes per calendar day in the second quarter of 2020 compared to 4.9 million tonnes, averaging 53,559 tonnes per calendar day in the same prior year period. Lower throughput was a result of a planned shutdown deferred from the first quarter and unplanned crusher maintenance in the second quarter of 2020.
Gold production in the second quarter of 2020 was 35,656 ounces compared to 48,513 ounces in the comparative prior year period due to lower throughput and lower grades. During the second quarter of 2020, Mount Milligan’s average process plant head grade was 0.39 g/t compared to 0.48 g/t in the second quarter of 2019. Total copper production was 19.1 million pounds in the second quarter of 2020 compared to 20.4 million pounds in the comparative prior year period, due to lower throughput and lower recoveries, partially offset by higher grades.
Processing costs per tonne were
Production costs per ounce of gold sold in the second quarter of 2020 were
Production costs per pound of copper sold in the second quarter of 2020 were
A photo accompanying this announcement is available at https://www.globenewswire.com/NewsRoom/AttachmentNg/48d3b4c0-75ce-4b41-a8b9-618efa6a9807
Mount Milligan’s all-in sustaining costs on a by-product basis per ounce soldNG, which excludes taxes, were
Including income taxes, all-in sustaining costs on a by-product basis per ounce soldNG were
First Half 2020 compared to First Half 2019
Mount Milligan’s earnings from mine operations was
A photo accompanying this announcement is available at https://www.globenewswire.com/NewsRoom/AttachmentNg/79e8089c-d656-4383-9809-0a5d28fd0002
Cash provided by mine operations in the first half of 2020 was
During the first half of 2020, mining activities were in phases 3, 4 and 8 of the open pit. Total tonnes mined in the first half of 2020 was 19.0 million tonnes and total material moved was 20.7 million tonnes. In the comparative half of 2019, total tonnes mined was 19.3 million tonnes and total material moved was 20.6 million tonnes.
Mining costs per tonne were
Total mill throughput was 9.2 million tonnes, averaging 50,791 tonnes per calendar day in the first half of 2020 compared to 7.3 million tonnes, averaging 40,354 tonnes per calendar day in the same prior year period. The increase in throughput is primarily related to the increased availability of water, and continuous improvement of our operations. In the first six months of 2020,
Gold production in the first half of 2020 was 69,337 ounces compared to 81,767 ounces in the comparative prior year period due to lower grades and recoveries. During the first half of 2020, Mount Milligan’s average process plant gold head grade was 0.38 g/t with a recovery of 63% compared to 0.53g/t with a recovery of 68% in the first half of 2019. Total copper production was 39.1 million pounds in the first half of 2020 compared to 31.8 million pounds in the comparative prior year period, primarily due to higher throughput and higher copper grades.
Processing costs per tonne were
Production costs per ounce of gold sold in the first half of 2020 were
Production costs per pound of copper sold in the first half of 2020 were
A photo accompanying this announcement is available at https://www.globenewswire.com/NewsRoom/AttachmentNg/1361d477-b5e9-4fd2-8613-3f051a6744d2
Mount Milligan’s all-in sustaining costs on a by-product basis per ounce soldNG, which excludes taxes, were
Including income taxes, all-in sustaining costs on a by-product basis per ounce soldNG were
Öksüt Mine
The Öksüt Mine is situated in
The Öksüt Mine achieved first gold pour on
COVID-19
On
In
Öksüt Mine
| ($ millions, except as noted) | Three months ended | Six months ended | |||
| 2020 | 2020 | ||||
| Financial Highlights: | |||||
| Revenue | $ | 14.6 | $ | 14.6 | |
| Production costs | 3.3 | 3.3 | |||
| Depreciation, depletion and amortization | 0.6 | 0.6 | |||
| Earnings from mine operations | $ | 10.7 | $ | 10.7 | |
| Cash provided by mine operations | 13.5 | 13.5 | |||
| Cash provided by mine operations before changes in working capital | 11.2 | 11.2 | |||
| Free cash flow (deficit) (1) | 5.0 | (15.4) | |||
| Operating Highlights: | |||||
| Tonnes mined (000's) | 3,448 | 6,323 | |||
| Tonnes ore mined (000's) | 496 | 1,067 | |||
| Ore mined - grade (g/t) | 0.99 | 0.94 | |||
| Ore crushed (000's) | 960 | 1,363 | |||
| Tonnes stacked (000's) | 877 | 1,179 | |||
| Heap leach grade (g/t) | 0.81 | 0.87 | |||
| Heap leach contained ounces stacked | 22,752 | 32,944 | |||
| Mining costs ($/t mined material) | 2.29 | 2.31 | |||
| Processing costs ($/t processed material) | 2.54 | 3.15 | |||
| Gold produced (ounces) | 10,791 | 15,277 | |||
| Gold sold (ounces) (2) | 12,188 | 15,003 | |||
| Average realized gold price ($/oz sold) (1) | 1,745 | 1,745 | |||
| Capital Expenditures - sustaining | - | - | |||
| Capital Expenditures - growth - cash | 4.1 | 17.6 | |||
| Capital Expenditures - stripping - cash (3)(4) | 1.1 | 1.1 | |||
| Capital Expenditures - total | 5.2 | 18.7 | |||
| Unit Costs: | |||||
| Production costs per ounce of gold sold | $ | 393 | $ | 393 | |
| Gold - All-in sustaining costs on a by-product basis ($/oz sold) (1)(3) | $ | 537 | $ | 537 | |
| Gold - All-in sustaining costs on a by-product basis - including taxes ($/oz sold) (1)(3) | $ | 537 | $ | 537 | |
(1) Non-GAAP measure. See discussion under “Non-GAAP Measures”.
(2) Includes 3,839 ounces sold pre-commercial production and 8,349 ounces sold post commercial production.
(3) Calculated starting from
(4) Excludes
Second Quarter 2020
Earnings from mine operations were
Cash provided by mine operations was
Mining in the second quarter of 2020 was focused on the development of phase 3 of the Keltepe pit, with total tonnes mined of 3.4 million tonnes, including 0.5 million tonnes of ore at an average gold grade of 0.99 g/t. Mining and crushing costs were
Processing in the second quarter of 2020 was focused on the preparation, stacking and irrigation of the heap leach pad. By the end of the quarter, all of phase 1A and half of phase 1B of the heap leach pad were completed and operational. At the end of
All-in sustaining costs on a by-product basis per ounce soldNG, which excludes taxes, were
During the second quarter of 2020, the Company spent
First half 2020
Earnings from mine operations in the first half of 2020 was
Cash provided by mine operations was
Total tonnes mined were 6.3 million tonnes in the first half of 2020 at a cost
Öksüt produced 15,277 ounces of gold in the first half of 2020, which included 5,619 ounces while in commercial production.
Öksüt’s processing costs were
As at
During the first half of 2020, the Company spent
Molybdenum Business
The molybdenum business includes two North American primary molybdenum mines that are currently on care and maintenance: the
The molybdenum business provides tolling treatment services for customers by converting molybdenum concentrates to molybdenum oxide powder, briquettes and ferromolybdenum products. Additionally, molybdenum concentrates are purchased to convert to upgraded products which are then sold in the metallurgical and chemical markets.
COVID-19
The Molybdenum Business instituted a social distancing policy for employees in confined and common areas, as well as a mask policy for all areas where social distancing of at least six feet cannot be achieved. Additional changes include general manager approval of all visitors, restricted site travel policies and promoting working remotely whenever possible. At the end of the quarter, to the best of the Company’s knowledge, the Molybdenum business remained COVID-19 free.
Molybdenum Operating Results
| ($ millions, except as noted) | Three months ended | Six months ended | ||||||||||||||
| Financial Highlights: | 2020 | 2019 | % Change | 2020 | 2019 | % Change | ||||||||||
| Molybdenum (Mo) | 25.3 | 56.7 | (55%) | 66.9 | 115.2 | (42%) | ||||||||||
| Tolling, Calcining and Other | 1.3 | 2.2 | (41%) | 2.9 | 5.1 | (43%) | ||||||||||
| Total Revenues and Other Income | $ | 26.6 | $ | 58.9 | (55%) | $ | 69.8 | $ | 120.4 | (42%) | ||||||
| Production costs | 30.9 | 56.6 | (45%) | 83.4 | 118.0 | (29%) | ||||||||||
| Depreciation, depletion and amortization | 1.9 | 1.3 | 47% | 3.4 | 2.4 | 40% | ||||||||||
| Reclamation expense | 17.1 | - | 0% | 43.5 | - | 0% | ||||||||||
| Care and Maintenance costs - Molybdenum mines | 3.2 | 3.9 | (18%) | 6.5 | 7.5 | (14%) | ||||||||||
| Net earnings | $ | (27.3) | $ | (4.3) | 535% | $ | (69.0) | $ | (9.7) | 611% | ||||||
| Total capital expenditure | 1.4 | 0.6 | 128% | 2.2 | 0.8 | 183% | ||||||||||
| Cash (used in) provided by operations (1) | (2.7) | (6.1) | 56% | 8.0 | (6.7 | ) | (219%) | |||||||||
| Free cash flow (deficit) (1) | (4.1) | (6.8) | 40% | 5.8 | (7.5 | ) | (177%) | |||||||||
| Average Mo spot price ($/lb) | 8.30 | 12.18 | (32%) | 9.02 | 11.98 | (25%) | ||||||||||
| Production Highlights (000's lbs): | ||||||||||||||||
| Mo purchased | 3,858 | 4,481 | (14%) | 7,200 | 8,709 | (17%) | ||||||||||
| Mo roasted | 3,606 | 5,350 | (33%) | 7,988 | 10,159 | (21%) | ||||||||||
| Mo sold | 2,666 | 4,225 | (37%) | 6,456 | 8,817 | (27%) | ||||||||||
| Toll roasted and upgraded Mo | 1,152 | 1,544 | (25%) | 1,962 | 3,198 | (39%) | ||||||||||
(1) Non-GAAP measure. See discussion under “Non-GAAP Measures”
Second Quarter 2020 compared to Second Quarter 2019
The Molybdenum business recorded a loss from operations in the second quarter of 2020 of
Cash used in operations in the second quarter of 2020 was
In the second quarter of 2020, 3.6 million pounds of molybdenum were roasted, including 1.2 million from tolling arrangements, which represented a 14% and 25% decrease over the same prior year periods, respectively. The decrease was the result of the decline in demand for industrial products that use molybdenum which was adversely affected by the demand disruption created by the COVID-19 pandemic.
A photo accompanying this announcement is available at https://www.globenewswire.com/NewsRoom/AttachmentNg/2a14ad81-1a26-49d2-a32f-8f4a6e188c90
First Half 2020 compared to First Half 2019
The Molybdenum business recorded a loss from operations in the first half of 2020 of
Cash provided by operations in the first half of 2020 was
In the first half of 2020, 8.0 million pounds of molybdenum were roasted, including 2.0 million pounds from tolling arrangements, which represented a 21% and 39% decrease over the same prior year periods, respectively. The decrease was primarily due to the decline in demand for industrial products that use molybdenum which was adversely affected by the demand disruption created by the COVID-19 pandemic.
Pre-Development Projects
COVID-19
Second Quarter 2020 compared to Second Quarter 2019
In the second quarter of 2020, the Company spent
First Half 2020 compared to First Half 2019
In the first half of 2020, the Company spent
Greenstone Gold Property:
The Greenstone Gold property is located in northern
At the end of the second quarter, Greenstone received federal approval of the Schedule 2 amendment of the Metal and Diamond Mining Effluent Regulations, which is a significant permitting milestone for the
COVID-19
The
Second Quarter 2020 compared to Second Quarter 2019
During the second quarter of 2020, the Company spent
First Half 2020 compared to First Half 2019
During the first half of 2020, the Company spent
Quarterly Results – Previous Eight Quarters
Over the last eight quarters, Centerra’s results reflect the impact of increasing gold sales during a period of rising gold prices. Production costs have also benefited from decreasing diesel fuel costs and depreciating Canadian, Kyrgyz and Turkish currencies over the last eight quarters. Gold sold on a quarterly basis steadily increased from the third quarter of 2018 to the third quarter of 2019, followed by a slight decline in the fourth quarter of 2019 and increasing again in the first half of 2020. The Company recognized a non-cash increase in ARO expenses of
| $ million, except per share data | 2020 | 2019 | 2018 | |||||||
| Quarterly data unaudited | ||||||||||
| Q2 | Q1 | Q4 | Q3 | Q2 | Q1 | Q4 | Q3 | |||
| Revenue | 413 | 374 | 313 | 388 | 341 | 334 | 392 | 259 | ||
| Net earnings (loss) | 81 | 20 | (12) | (165) | 33 | 50 | 49 | 6 | ||
| Basic earnings (loss) per share | 0.27 | 0.07 | (0.04) | (0.56) | 0.11 | 0.17 | 0.17 | 0.02 | ||
| Diluted earnings (loss) per share | 0.27 | 0.06 | (0.04) | (0.56) | 0.11 | 0.17 | 0.17 | 0.01 | ||
Contingencies
The following is a summary of contingencies with respect to matters affecting the Company and its subsidiaries. Readers are cautioned that the following is only a brief summary of such matters. For a more complete discussion of these matters, see the Company’s news releases and its Annual Information Form for the year ended
Kyrgyz Republic
Lysii Waste Dump Accident
On
Petrov Lake Accident
On
In the first quarter of 2020, the Company has received a notice of civil claim from
Greenstone Gold Property
As previously disclosed, on
Other
The Company operates in multiple countries around the world and accordingly is subject to, and pays, taxes under the various regimes in those jurisdictions in which it operates. These tax regimes are determined under general taxation and other laws of the respective jurisdiction. The Company has historically filed, and continues to file, all required tax returns and to pay the taxes reasonably determined to be due. The tax rules and regulations in many countries are complex and subject to interpretation. From time to time the Company’s tax filings are subject to review and in connection with such reviews, disputes can arise with the taxing authorities over the Company’s interpretation of the country’s tax laws. The Company records provisions for future disbursements considered probable. As at
Accounting Estimates, Policies and Changes
Accounting Estimates
The preparation of the Company’s consolidated financial statements in accordance with IFRS required management to make estimates and judgments that affect the amounts reported in the consolidated financial statements and accompanying notes. The critical estimates and judgments applied in the preparation of the Company’s condensed consolidated interim financial statements for the three and six months ended
Management’s estimates and underlying assumptions are reviewed on an ongoing basis. Any changes or revisions to estimates and underlying assumptions are recognized in the period in which the estimates are revised and in any future periods affected. Changes to these critical accounting estimates could have a material impact on the consolidated financial statements.
The key sources of estimation uncertainty and judgment used in the preparation of the consolidated financial statements that have a significant risk of causing a material adjustment to the carrying amounts of assets and liabilities and earnings within the next financial year are outlined in detail in note 4 of the
Disclosure Controls and Procedures and Internal Control Over Financial Reporting
The Company’s management, including the CEO and CFO, is responsible for the design of disclosure controls and procedures (“DC&P”) and internal controls over financial reporting (“ICFR”). Centerra adheres to the Committee of Sponsoring Organizations of the Treadway Commission’s (COSO) revised 2013 Internal Control Framework for the design of its ICFR. There was no material change to the Company’s internal controls over financial reporting that occurred during the second quarter of 2020 that has materially affected, or is reasonably likely to materially affect, the Company’s internal controls over financial reporting.
The evaluation of DC&P and ICFR was carried out under the supervision of and with the participation of management, including Centerra’s CEO and CFO. Based on these evaluations, the CEO and the CFO concluded that the design and operation of these DC&P and ICFR were effective throughout the second quarter of 2020.
Non-GAAP Measures
This document contains the following non-GAAP financial measures: all-in sustaining costs per ounce sold on a by-product basis, all-in sustaining costs per ounce sold on a by-product basis including taxes, and all-in sustaining costs per ounce sold on a co-product basis. In addition, non-GAAP financial measures include adjusted net earnings, adjusted net earnings per common share (basic and diluted), average realized gold price, average realized copper price, adjusted cash provided by operations, free cash flow and adjusted free cash flow. These financial measures do not have any standardized meaning prescribed by GAAP and are therefore unlikely to be comparable to similar measures presented by other issuers, even as compared to other issuers who may be applying the
Management believes that the use of these non-GAAP measures will assist analysts, investors and other stakeholders of the Company in understanding the costs associated with producing gold, understanding the economics of gold mining, assessing our operating performance, our ability to generate free cash flow from current operations and to generate free cash flow on an overall Company basis, and for planning and forecasting of future periods. However, the measures do have limitations as analytical tools as they may be influenced by the point in the life cycle of a specific mine and the level of additional exploration or expenditures a company has to make to fully develop its properties. Accordingly, these non-GAAP measures should not be considered in isolation, or as a substitute for, analysis of our results as reported under GAAP.
Definitions
The following is a description of the non-GAAP measures used in this MD&A:
- All-in sustaining costs on a by-product basis per ounce sold include production costs, the cash component of capitalized stripping costs, corporate general and administrative expenses, accretion expenses, and sustaining capital, net of copper and silver credits. The measure incorporates costs related to sustaining production. Copper and silver credits represent the expected revenue from the sale of these metals.
- All-in sustaining costs on a by-product basis per ounce sold including taxes, include revenue-based tax at Kumtor and taxes (mining and income) at
Mount Milligan . - All-in sustaining costs on a co-product basis per ounce of gold sold or per pound of copper sold, production costs are allocated between copper and gold based on production. To calculate the allocation of production costs, copper production has been converted to ounces of gold equivalent using the copper production for the periods presented, as well as an average of the futures prices during the quotational pricing period for copper and gold sold from
Mount Milligan . For the second quarter and first half of 2020, 706 and 660 pounds of copper, respectively, were equivalent to one ounce of gold. - Adjusted net earnings is calculated by adjusting net earnings (loss) as recorded in the condensed consolidated interim statements of income (loss) and comprehensive income (loss) for items not associated with ongoing operations.
- Adjusted cash provided by operations is calculated by adjusting cash provided by operations as recorded in the condensed consolidated interim statements of statements of cash flows for items not associated with ongoing operations.
- Average realized gold price is calculated by dividing the different components of gold sales (including third party sales, mark to market adjustments, final pricing adjustments and the fixed amount received under the Mount Milligan Streaming Arrangement) by the number of ounces sold.
- Average realized copper price is calculated by dividing the different components of copper sales (including third party sales, mark to market adjustments, final pricing adjustments and the fixed amount received under the Mount Milligan Streaming Arrangement) by the number of pounds sold.
- Free cash flow is calculated as cash provided by operations less additions to property, plant and equipment.
- Adjusted free cash flow is calculated as free cash flow adjusted for items not associated with ongoing operations.
All-in Sustaining Costs on a by-product basis (including and excluding taxes) per ounce of gold are non-GAAP measures and can be reconciled as follows:
| Three months ended | Six months ended | |||||||||||||||
| (Unaudited - $ millions, unless otherwise specified) | Consolidated (1) | Kumtor(1) | Mount Milligan(1) | Öksüt(1)(2) | Consolidated (1) | Kumtor(1) | Mount Milligan(1) | Öksüt(1)(2) | ||||||||
| 2020 | 2019 | 2020 | 2019 | 2020 | 2019 | 2020 | 2019 | 2020 | 2019 | 2020 | 2019 | 2020 | 2019 | 2020 | 2019 | |
| Production costs attributable to gold | 87.7 | 95.0 | 54.7 | 60.3 | 29.7 | 34.7 | 3.3 | - | 378.1 | 347.4 | 224.6 | 198.9 | 149.6 | 148.5 | 3.9 | - |
| Production costs attributable to copper | 23.3 | 30.9 | - | - | 23.3 | 30.9 | - | - | 155.1 | 111.0 | 118.5 | 84.6 | 36.0 | 26.4 | 0.6 | - |
| Total Production costs excluding molybdenum segment, as reported | 111.0 | 125.9 | 54.7 | 60.3 | 53.0 | 65.6 | 3.3 | - | 223.0 | 236.4 | 106.1 | 114.3 | 113.6 | 122.1 | 3.3 | - |
| Adjust for: | ||||||||||||||||
| Selling and marketing | 1.9 | 2.5 | - | - | 1.9 | 2.5 | - | - | 4.0 | 3.7 | - | - | 4.0 | 3.7 | - | - |
| Refining fees | 2.0 | 1.4 | 1.8 | 1.2 | 0.2 | 0.2 | - | - | 3.9 | 2.8 | 3.5 | 2.4 | 0.4 | 0.4 | - | - |
| By-product credits - copper | (39.8) | (36.4) | - | - | (39.8) | (36.4) | - | - | (72.7) | (67.5) | - | - | (72.7) | (67.5) | - | - |
| Community costs related to current operations | 2.3 | 0.9 | 2.3 | 0.9 | - | - | - | - | 13.6 | 2.1 | 13.6 | 2.1 | - | - | - | - |
| Adjusted Production Costs | 77.3 | 94.3 | 58.8 | 62.4 | 15.3 | 31.9 | 3.3 | - | 171.7 | 177.5 | 123.2 | 118.8 | 45.2 | 58.7 | 3.3 | - |
| Corporate general administrative and other costs | 25.6 | 13.6 | - | - | 0.5 | - | - | - | 28.7 | 23.2 | - | - | 0.5 | - | - | - |
| Accretion expense | 0.2 | 0.5 | 0.3 | 0.4 | (0.1) | 0.1 | - | - | 0.5 | 1.0 | 0.5 | 0.7 | - | 0.3 | - | - |
| Capitalized stripping | 36.1 | 12.1 | 35.0 | 12.1 | - | - | 1.1 | - | 66.1 | 29.4 | 65.0 | 29.4 | - | - | 1.1 | - |
| Capital expenditures (sustaining) | 31.6 | 20.2 | 24.5 | 11.3 | 7.1 | 8.9 | - | - | 45.4 | 39.9 | 33.0 | 20.3 | 12.4 | 19.6 | - | - |
| Lease principal payments | 1.1 | 1.3 | - | - | 1.0 | 1.3 | 0.1 | - | 2.2 | 2.5 | - | - | 2.1 | 2.5 | 0.1 | - |
| All-in Sustaining Costs on a by-product basis | 171.9 | 142.0 | 118.6 | 86.2 | 23.8 | 42.2 | 4.5 | - | 314.6 | 273.4 | 221.7 | 169.2 | 60.2 | 81.0 | 4.5 | - |
| Revenue-based taxes | 40.4 | 27.8 | 40.4 | 27.8 | - | - | - | - | 75.5 | 55.2 | 75.5 | 55.2 | - | - | - | - |
| Income and mining taxes | 1.3 | 0.9 | - | - | 1.3 | 0.9 | - | - | 2.1 | 1.7 | - | - | 2.1 | 1.7 | - | - |
| All-in Sustaining Costs on a by-product basis (including taxes) | 213.6 | 170.7 | 159.0 | 114.0 | 25.1 | 43.1 | 4.5 | - | 392.3 | 330.3 | 297.2 | 224.4 | 62.3 | 82.7 | 4.5 | - |
| Ounces sold (000's) | 213.8 | 198.3 | 170.4 | 153.3 | 35.0 | 45.0 | 8.4 | - | 414.2 | 394.8 | 330.4 | 303.6 | 75.4 | 91.2 | 8.4 | - |
| Pounds sold (millions) | 19.4 | 18.7 | - | - | 19.4 | 18.7 | - | - | ||||||||
| Production costs per ounce of gold sold ($ /oz sold) | 410 | 479 | 321 | 393 | 849 | 771 | 393 | - | 417 | 468 | 321 | 376 | 837 | 773 | 393 | - |
| Production costs per pound of copper sold ($ /pound sold) | 1.20 | 1.65 | n/a | n/a | 1.20 | 1.65 | n/a | n/a | 1.27 | 1.65 | n/a | n/a | 1.27 | 1.65 | n/a | n/a |
| Gold - All-in Sustaining Costs on a by-product basis ($ /oz sold) | 804 | 716 | 696 | 562 | 679 | 938 | 537 | - | 760 | 693 | 671 | 557 | 798 | 889 | 537 | - |
| Gold - All-in Sustaining Costs on a by-product basis (including taxes) - ($ /oz sold) | 999 | 861 | 933 | 744 | 716 | 958 | 537 | - | 947 | 837 | 900 | 739 | 827 | 908 | 537 | - |
| Gold - All-in Sustaining Costs on a co-product basis - before taxes ($ /oz sold) | 860 | 712 | 696 | 562 | 1,020 | 925 | 537 | - | 790 | 705 | 671 | 557 | 967 | 942 | 537 | - |
| Copper - All-in Sustaining Costs on a co-product basis - before taxes ($ /pound sold) | 1.44 | 1.97 | n/a | n/a | 1.44 | 1.97 | n/a | n/a | 1.46 | 2.01 | n/a | n/a | 1.46 | 2.01 | n/a | - |
| (1) Results may not add due to rounding | ||||||||||||||||
| (2) Reflects costs while in commercial production | ||||||||||||||||
Adjusted net earnings can be reconciled as follows:
Adjusted net earnings is intended to provide investors with information about the Company’s continuing income generating capabilities. This measure adjusts for the earnings impact of items not associated with ongoing operations.
| Three months ended | Six months ended | ||||||||
| ($ millions, except as noted) | 2020 | 2019 | 2020 | 2019 | |||||
| Net earnings | $ | 80.7 | $ | 33.4 | $ | 100.8 | $ | 83.8 | |
| Adjust for items not associated with ongoing operations: | |||||||||
| ARO revaluation at sites on care and maintenance | 17.1 | - | 43.5 | ||||||
| Adjusted net earnings | $ | 97.8 | $ | 33.4 | $ | 144.3 | $ | 83.8 | |
| Net earnings per share - basic | $ | 0.27 | $ | 0.11 | $ | 0.34 | $ | 0.29 | |
| Net earnings per share - diluted | $ | 0.27 | $ | 0.11 | $ | 0.34 | $ | 0.29 | |
| Adjusted net earnings per share - basic | $ | 0.33 | $ | 0.11 | $ | 0.49 | $ | 0.29 | |
| Adjusted net earnings per share - diluted | $ | 0.33 | $ | 0.11 | $ | 0.49 | $ | 0.29 | |
Free cash flow is calculated as follows:
| Three months ended | Six months ended | ||||||||||||
| ($ millions, except as noted) | 2020 | 2019 | 2020 | 2019 | |||||||||
| Cash provided by operations (1) | $ | 268.1 | $ | 91.0 | $ | 389.2 | $ | 209.8 | |||||
| Adjust for: | |||||||||||||
| Additions to property, plant and equipment (1) | (99.0) | (60.3) | (143.3) | (122.1) | |||||||||
| Free cash flow (deficit) | $ | 169.1 | $ | 30.7 | $ | 245.9 | $ | 87.7 | |||||
(1) As presented in the Company’s Consolidated Statement of Cash Flows
Average realized sales price for gold
The average realized gold price per ounce sold is calculated by dividing gold sales revenue, together with the final pricing adjustments and mark-to-market adjustments by the ounces sold, as shown in the table below:
| Average realized sales price for gold | Three months ended | Six months ended | ||
| 2020 | 2019 | 2020 | 2019 | |
| Gold sales reconciliation ($ millions) | ||||
| Gold sales - Kumtor | 286.4 | 197.7 | 535.3 | 392.6 |
| Gold sales - Öksüt | 14.6 | - | 14.6 | - |
| Gold sales - Mt. Milligan | ||||
| Gold sales related to cash portion of Royal Gold stream | 5.3 | 6.9 | 11.3 | 13.8 |
| Mark-to-market adjustments on sales to Royal Gold | 1.2 | (1.5) | 0.8 | (1.4) |
| Final adjustments on sales to Royal Gold | (4.5) | 0.6 | (5.3) | - |
| Total gold sales under Royal Gold stream | 2.0 | 6.0 | 6.8 | 12.4 |
| Gold sales to third party customers | 35.5 | 38.5 | 76.1 | 77.4 |
| Mark-to-market adjustments | 5.6 | 5.0 | 5.0 | 4.4 |
| Final pricing adjustments | 2.3 | (1.0) | 5.9 | 0.1 |
| Final metal adjustments | 0.1 | (0.7) | 0.8 | 0.1 |
| Total gold sales to third party customers | 43.5 | 41.8 | 87.8 | 82.0 |
| Gold sales, net of adjustments | 45.5 | 47.8 | 94.6 | 94.4 |
| Refining and treatment costs | (0.2) | (0.2) | (0.3) | (0.5) |
| Total gold sales | 45.3 | 47.6 | 94.3 | 93.9 |
| Total gold revenue - Consolidated | 346.3 | 245.3 | 644.2 | 486.5 |
| Ounces of gold sold | ||||
| Gold ounces sold - Kumtor | 170,350 | 153,307 | 330,440 | 303,574 |
| Gold ounces sold - Öksüt | 8,349 | - | 8,349 | - |
| Ounces sold to Royal Gold - Mt. Milligan | 12,192 | 15,668 | 26,219 | 31,682 |
| Ounces sold to third party customers - Mt. Milligan | 22,809 | 29,312 | 49,135 | 59,482 |
| Total ounces sold - Consolidated (1) | 213,701 | 198,287 | 414,143 | 394,738 |
| Average realized sales price for gold on a per ounce basis | ||||
| Average realized sales price - Kumtor | 1,681 | 1,289 | 1,620 | 1,293 |
| Average realized sales price - Öksüt | 1,745 | - | 1,745 | - |
| Average realized gold price - Royal Gold | 435 | 435 | 435 | 435 |
| Average realized gold price - Mark-to-market adjustments | 97 | (94) | 32 | (44) |
| Average realized gold price - Final pricing adjustments | (366) | 35 | (203) | (1) |
| Average realized gold price - Mt. Milligan - Royal Gold | 166 | 376 | 265 | 390 |
| Average realized gold price - Third party | 1,557 | 1,313 | 1,549 | 1,301 |
| Average realized gold price - Mark-to-market adjustments | 245 | 169 | 102 | 74 |
| Average realized gold price - Final pricing adjustments | 101 | (33) | 120 | 2 |
| Average realized gold price - Final metal adjustments | 3 | (23) | 16 | 2 |
| Average realized gold price - Mt. Milligan - Third party | 1,906 | 1,426 | 1,787 | 1,379 |
| Average realized gold price - Mt. Milligan - Combined | 1,295 | 1,058 | 1,252 | 1,031 |
| Average realized sales price for gold - Consolidated | 1,620 | 1,237 | 1,555 | 1,232 |
(1) Includes ounces sold at Öksüt from
Average realized sales price for Copper -
The average realized copper price per pound is calculated by dividing copper sales revenue, together with the final pricing adjustments and mark-to-market adjustments per pound, as shown in the table below:
| Average realized sales price for Copper - | Three months ended | Six months ended | ||
| 2020 | 2019 | 2020 | 2019 | |
| Copper sales reconciliation ($ millions) | ||||
| Copper sales related to cash portion of Royal Gold stream | 1.2 | 1.5 | 2.6 | 2.5 |
| Mark-to-market adjustments on Royal Gold stream | (1.1) | 0.3 | (0.7) | 0.1 |
| Final adjustments on sales to Royal Gold | - | (0.1) | 0.3 | (0.7) |
| Total copper sales under Royal Gold stream | 0.1 | 1.7 | 2.3 | 1.9 |
| Copper sales to third party customers | 35.1 | 41.2 | 75.7 | 70.4 |
| Mark-to-market adjustments | 9.3 | (2.2) | 4.5 | (0.6) |
| Final pricing adjustments | (0.5) | 0.3 | (1.6) | 4.6 |
| Final metal adjustments | (0.7) | (0.3) | (0.9) | (0.9) |
| Total copper sales to third party customers | 43.2 | 39.0 | 77.8 | 73.5 |
| Copper sales, net of adjustments | 43.3 | 40.7 | 80.1 | 75.4 |
| Refining and treatment costs | (3.5) | (4.3) | (7.4) | (7.9) |
| Copper sales | 39.8 | 36.4 | 72.7 | 67.5 |
| Pounds of copper sold (000's lbs) | ||||
| Pounds sold to Royal Gold | 3,641 | 3,512 | 7,479 | 5,868 |
| Pounds sold to third party customers | 15,712 | 15,187 | 32,297 | 25,354 |
| Total pounds sold | 19,352 | 18,700 | 39,776 | 31,222 |
| Average realized sales price for copper on a per pound basis | ||||
| Copper sales related to cash portion of Royal Gold stream | 0.33 | 0.42 | 0.35 | 0.43 |
| Mark-to-market adjustments on Royal Gold stream | (0.30) | 0.08 | (0.09) | 0.01 |
| Final pricing adjustments on Royal Gold stream | 0.01 | (0.02) | 0.04 | (0.11) |
| Average realized copper price - Royal Gold | 0.03 | 0.48 | 0.30 | 0.33 |
| Average realized copper price - Third party | 2.23 | 2.70 | 2.35 | 2.25 |
| Average realized copper price - Mark-to-market adjustments | 0.59 | (0.14) | 0.14 | (0.02) |
| Average realized copper price - Final pricing adjustments | (0.03) | 0.02 | (0.05) | 0.18 |
| Average realized copper price - Metal pricing adjustments | (0.04) | (0.02) | (0.04) | (0.05) |
| Average realized copper price - Third party | 2.75 | 2.56 | 2.40 | 2.36 |
| Average realized copper price - Combined | 2.06 | 1.95 | 1.83 | 2.16 |
Qualified Person & QA/QC – Production, Mineral Reserves and Mineral Resources
All mineral reserve and mineral resource estimates and other scientific and technical information in this document were prepared in accordance with the standards of the
| Condensed Consolidated Interim Statements of Financial Position | ||||||
| (Unaudited) | ||||||
| 2020 | 2019 | |||||
| (Expressed in thousands of United States Dollars) | ||||||
| Assets | ||||||
| Current assets | ||||||
| Cash | $ | 212,213 | $ | 42,717 | ||
| Amounts receivable | 52,367 | 79,022 | ||||
| Inventories | 689,463 | 774,060 | ||||
| Other current assets | 38,564 | 36,869 | ||||
| 992,607 | 932,668 | |||||
| Property, plant and equipment | 1,706,269 | 1,669,516 | ||||
| Reclamation deposits | 47,085 | 40,999 | ||||
| Other assets | 23,352 | 58,470 | ||||
| 1,776,706 | 1,768,985 | |||||
| Total assets | $ | 2,769,313 | $ | 2,701,653 | ||
| Liabilities and Shareholders' equity | ||||||
| Current liabilities | ||||||
| Accounts payable and accrued liabilities | $ | 220,640 | $ | 238,339 | ||
| Revenue-based taxes payable | 17,254 | 744 | ||||
| Taxes payable | 1,961 | 1,034 | ||||
| Other current liabilities | 12,869 | 4,692 | ||||
| 252,724 | 244,809 | |||||
| Long-term debt | - | 70,007 | ||||
| Deferred income tax liability | 32,803 | 33,733 | ||||
| Provision for reclamation | 310,637 | 265,049 | ||||
| Other liabilities | 21,490 | 22,211 | ||||
| 364,930 | 391,000 | |||||
| Shareholders' equity | ||||||
| Share capital | 966,212 | 960,404 | ||||
| Contributed surplus | 26,060 | 26,278 | ||||
| Accumulated other comprehensive loss | (4,091) | (752) | ||||
| Retained earnings | 1,163,478 | 1,079,914 | ||||
| 2,151,659 | 2,065,844 | |||||
| Total liabilities and Shareholders' equity | $ | 2,769,313 | $ | 2,701,653 | ||
| Condensed Consolidated Interim Statements of Earnings and Comprehensive Income | |||||||||||||
| (Unaudited) | Three months ended | Six months ended | |||||||||||
| 2020 | 2019 | 2020 | 2019 | ||||||||||
| (Expressed in thousands of United States Dollars) | |||||||||||||
| (except per share amounts) | |||||||||||||
| Revenue | $ | 412,654 | $ | 340,510 | $ | 786,700 | $ | 674,549 | |||||
| Cost of sales | |||||||||||||
| Production costs | 141,918 | 182,654 | 306,552 | 354,429 | |||||||||
| Depreciation, depletion and amortization | 85,443 | 58,963 | 158,465 | 113,395 | |||||||||
| Standby costs | - | - | 6,728 | - | |||||||||
| Earnings from mine operations | 185,293 | 98,893 | 314,955 | 206,725 | |||||||||
| Care and maintenance | 7,074 | 6,881 | 13,862 | 14,204 | |||||||||
| Exploration and business development | 8,952 | 10,420 | 18,455 | 18,712 | |||||||||
| Corporate administration | 25,271 | 13,690 | 28,718 | 23,388 | |||||||||
| Revenue-based taxes | 40,359 | 27,777 | 75,464 | 55,171 | |||||||||
| Other operating expenses | 22,925 | 4,151 | 63,700 | 7,119 | |||||||||
| Earnings from operations | 80,712 | 35,974 | 114,756 | 88,131 | |||||||||
| Other (income) expenses, net | (2,239) | (613) | 5,331 | (755) | |||||||||
| Finance costs | 3,817 | 3,697 | 7,418 | 7,678 | |||||||||
| Earnings before income tax | 79,134 | 32,890 | 102,007 | 81,208 | |||||||||
| Income tax (recovery) expense | (1,609) | (524) | 1,256 | (2,638) | |||||||||
| Net earnings | 80,743 | 33,414 | 100,751 | 83,846 | |||||||||
| Other Comprehensive Income | |||||||||||||
| Items that may be subsequently reclassified to earnings: | |||||||||||||
| Net (loss) gain on translation of foreign operations | (592) | 712 | (1,607) | 1,447 | |||||||||
| Net unrealized (loss) gain on derivative instruments, net of tax | (1,930) | 166 | (1,732) | (25) | |||||||||
| Other comprehensive (loss) income | (2,522) | 878 | (3,339) | 1,422 | |||||||||
| Total comprehensive income | $ | 78,221 | $ | 34,292 | $ | 97,412 | $ | 85,268 | |||||
| Basic earnings per share | $ | 0.27 | $ | 0.11 | $ | 0.34 | $ | 0.29 | |||||
| Diluted earnings per share | $ | 0.27 | $ | 0.11 | $ | 0.34 | $ | 0.29 | |||||
| Condensed Consolidated Interim Statements of Cash Flows | |||||||||||||
| (Unaudited) | Three months ended | Six months ended | |||||||||||
| 2020 | 2019 | 2020 | 2019 | ||||||||||
| (Expressed in thousands of United States Dollars) | |||||||||||||
| Operating activities | |||||||||||||
| Net earnings | $ | 80,743 | $ | 33,414 | $ | 100,751 | $ | 83,846 | |||||
| Adjustments for the following items: | |||||||||||||
| Depreciation, depletion and amortization | 90,352 | 60,575 | 165,082 | 116,310 | |||||||||
| Finance costs | 3,817 | 3,697 | 7,418 | 7,678 | |||||||||
| Share-based compensation expense | 20,470 | 4,792 | 17,231 | 11,499 | |||||||||
| Inventory impairment | 6,100 | - | 13,588 | - | |||||||||
| Income tax (recovery) expense, net | (1,609) | (524) | 1,256 | (2,638) | |||||||||
| Reclamation expense | 17,065 | - | 43,505 | 615 | |||||||||
| Income tax (paid) refunded | (1,015) | (612) | 9,849 | (267) | |||||||||
| Other | 178 | 54 | 719 | (1,439) | |||||||||
| Cash provided by operations before changes in operating working capital | $ | 216,101 | $ | 101,396 | $ | 359,399 | $ | 215,604 | |||||
| Change in operating working capital | 51,959 | (10,400) | 29,817 | (5,854) | |||||||||
| Cash provided by operations | $ | 268,060 | $ | 90,996 | $ | 389,216 | $ | 209,750 | |||||
| Investing activities | |||||||||||||
| Additions to property, plant and equipment | (98,996) | (60,341) | (143,263) | (122,102) | |||||||||
| Proceeds from disposition of fixed assets | 175 | - | 308 | - | |||||||||
| Decrease in restricted cash | 149 | 5 | 25,990 | 21 | |||||||||
| Decrease (increase) in other assets | 2,267 | (549) | (4,951) | (5,256) | |||||||||
| Cash used in investing | $ | (96,405) | $ | (60,885) | $ | (121,916) | $ | (127,337) | |||||
| Financing activities | |||||||||||||
| Debt drawdown | 114,000 | 31,035 | 250,000 | 85,854 | |||||||||
| Debt repayment | (250,000) | (100,000) | (327,472) | (176,000) | |||||||||
| Payment of interest and borrowing costs | (2,789) | (2,309) | (4,854) | (5,258) | |||||||||
| Dividends paid | (16,992) | - | (16,992) | - | |||||||||
| Lease payments | (1,415) | (1,448) | (3,152) | (2,849) | |||||||||
| Proceeds from common shares issued | 3,908 | 2,169 | 4,666 | 4,114 | |||||||||
| Cash used in financing | $ | (153,288) | $ | (70,553) | $ | (97,804) | $ | (94,139) | |||||
| Increase (decrease) in cash during the period | 18,367 | (40,442) | 169,496 | (11,726) | |||||||||
| Cash at beginning of the period | 193,846 | 180,421 | 42,717 | 151,705 | |||||||||
| Cash at end of the period | $ | 212,213 | $ | 139,979 | $ | 212,213 | $ | 139,979 | |||||
The Unaudited Interim Consolidated Financial Statements and Notes for the three and six months ended

2020 GlobeNewswire, Inc., source

