DREAM OFFICE REAL ESTATE INVESTMENT TRUST (D.UN-TSX) or (“Dream Office REIT”, the “Trust” or “we”) today announced its financial results for the three months ended March 31, 2022 and provided a business update related to the COVID-19 pandemic.
This press release features multimedia. View the full release here: https://www.businesswire.com/news/home/20220505005870/en/
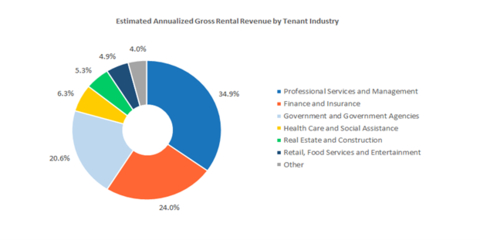
Estimated Annualized Gross Rental Revenue by Tenant Industry
OPERATIONAL HIGHLIGHTS
(unaudited) | As at | |||||||
| March 31, |
|
| December 31, |
|
| March 31, | |
|
| 2022 |
|
| 2021 |
|
| 2021 |
Total properties(1) |
|
|
|
|
|
|
|
|
Number of active properties |
| 29 |
|
| 29 |
|
| 28 |
Number of properties under development |
| 1 |
|
| 1 |
|
| 2 |
Gross leaseable area (“GLA”) (in millions of sq. ft.) |
| 5.5 |
|
| 5.5 |
|
| 5.5 |
Investment properties value | $ | 2,596,240 |
| $ | 2,569,002 |
| $ | 2,473,123 |
Total portfolio(2) |
|
|
|
|
|
|
|
|
Occupancy rate – including committed (period-end) |
| 85.0% |
|
| 85.5% |
|
| 87.2% |
Occupancy rate – in-place (period-end) |
| 81.7% |
|
| 82.9% |
|
| 85.8% |
Average in-place and committed net rent per square foot (period-end) | $ | 23.25 |
| $ | 23.25 |
| $ | 23.26 |
Weighted average lease term (“WALT”) (years) |
| 5.4 |
|
| 5.2 |
|
| 5.0 |
See footnotes at end.
|
| Three months ended | |||
|
| March 31, |
|
| March 31, |
|
| 2022 |
|
| 2021 |
Operating results |
|
|
|
|
|
Net income | $ | 52,282 |
|
| 10,146 |
Funds from operations (“FFO”)(3) |
| 21,043 |
|
| 21,309 |
Net rental income |
| 25,863 |
|
| 26,271 |
Comparative properties net operating income (“NOI”)(4) |
| 27,320 |
|
| 28,710 |
Per unit amounts |
|
|
|
|
|
FFO (diluted)(5) | $ | 0.39 |
|
| 0.38 |
Distribution rate |
| 0.25 |
|
| 0.25 |
See footnotes at end.
“Our business has continued to navigate through uncertainties in the economy and recovery from the pandemic with resilience,” said Michael Cooper, Chief Executive Officer of Dream Office REIT. “We think our strategy of focusing on our best assets to improve their quality, reducing carbon emissions, animating the retail and common areas and making our office communities more inclusive will be very well received by our tenants as they return to work and will add value to the portfolio.”
- Net income for the quarter: For the three months ended March 31, 2022, the Trust generated net income of $52.3 million. Included in net income for the three months ended March 31, 2022 are net rental income totalling $25.9 million, share of net income from investment in Dream Industrial REIT totalling $42.9 million and positive fair value adjustments to investment properties totalling $19.4 million primarily due to fair value gains at four properties valued by qualified external valuation professionals. Partially offsetting these items were negative fair value adjustments to financial instruments for the three months ended March 31, 2022 totalling $20.3 million primarily due to the revaluation of the subsidiary redeemable units as a result of appreciation in the Trust’s unit price.
- Diluted FFO per unit(5) for the quarter: For the three months ended March 31, 2022, diluted FFO per unit increased to $0.39 per unit relative to $0.38 per unit in Q1 2021 as NOI from our completed development at 1900 Sherwood Place in Regina (+$0.02), higher FFO from our investment in Dream Industrial REIT (+$0.02) and the effect of accretive unit repurchases under our Normal Course Issuer Bid (“NCIB”) program (+$0.01) were partially offset by lower comparative properties NOI (-$0.03) and other items (-$0.01).
- Net rental income for the quarter: Net rental income for the three months ended March 31, 2022 decreased by $0.4 million relative to the prior year comparative quarter primarily due to lower weighted average occupancy in Toronto downtown and lower rents on renewals and new leases in the regions that we collectively refer to as Other markets, comprising our properties located in Calgary, Saskatchewan, Mississauga, Scarborough and the United States. Partially offsetting the year-over-year decrease were net rental income from our completed property under development at 1900 Sherwood Place in Regina, higher net rents on renewals and new leasing in Toronto downtown and higher parking revenues.
- Comparative properties NOI(4) for the quarter: For the three months ended March 31, 2022, comparative properties NOI decreased by 4.8%, or $1.4 million, over the prior year comparative quarter, primarily driven by declines in weighted average occupancy in Toronto downtown and lower in-place rents in the Other markets region. Partially offsetting the declines were higher rates on renewals and new leases in Toronto downtown, higher weighted average occupancy in the Other markets region and favourable parking revenues of $0.2 million across the portfolio.
Over the course of the COVID-19 pandemic, we saw significant reductions in leasing activity and building traffic relative to historical norms, leading to declines in occupancy and parking income as a result of repeated states of emergency in Toronto. Despite the public health measures enacted in response to the Omicron variant in December 2021 and January 2022, we continue to anticipate that many companies will return their employees to the office during 2022 and, with that, leasing activity and traffic flow to our properties will improve and our comparative properties NOI and parking revenues will begin to normalize.
We are actively managing our assets in the Toronto downtown region, which represent 82% of our active portfolio investment property fair values, to improve the quality of the buildings and to continue to improve rental rates in this market. For our assets in the Other markets region, which make up the remaining 18% of our total portfolio investment properties fair value, we are repositioning these assets to improve occupancy and liquidity in the private market.
- In-place occupancy: Total portfolio in-place occupancy on a quarter-over-quarter basis decreased by 1.2% relative to Q4 2021 to 81.7%. In Toronto downtown, 95,000 square feet of early terminations and 42,000 square feet of expiries were partially offset by 19,000 square feet of new leasing activity and 10,000 square feet of renewals. Within the 95,000 square feet of early terminations, 80,000 square feet relates to a negotiated tenant downsize on renewal for a lease expiring in Q4 2022. The Trust has leased 54,000 square feet of the returned space for a ten-year term commencing in the first half of 2023 with a leading provider of flexible workspace for enterprise clients for its first Canadian location and is in advanced negotiations for a further 13,000 square feet of the remaining space. Under the terms of the lease, the Trust is entitled to a share of the tenant’s net revenues plus additional rents. The Trust expects to achieve revenues from the space equal to or higher than the equivalent market rental rate on a stabilized basis. The renewing tenant retained 82,000 of its 139,000 square feet for a period of ten years with initial rents on the retained space 36% higher than expiring rates with progressive rent steps to a 68% increase over expiring rates by the end of the term. The remaining 57,000 square feet of space is currently sublet and the Trust is in advanced negotiations with those subtenants for 45,000 square feet of the subleased space. The Trust is actively marketing the remaining 25,000 square feet to prospective tenants.
In the Other markets region, 53,000 square feet of new leasing activity and 13,000 square feet of renewals were partially offset by 23,000 square feet of expiries.
Total portfolio in-place occupancy on a year-over-year basis decreased from 85.8% at Q1 2021 to 81.7% this quarter due to net negative absorption in Toronto downtown partially offset by the reclassification of 1900 Sherwood Place to active properties in Q3 2021 and net positive absorption in Other markets during Q4 2021 and Q1 2022.
- Lease commencements for the quarter: For the three months ended March 31, 2022, 71,000 square feet of leases commenced, not including temporary leases. In Toronto downtown, 22,000 square feet of leases commenced at $35.13 per square foot, or 28.3% higher than the previous rent in the same space. In the Other markets region, 49,000 square feet of leases commenced at $11.43 per square foot or 35.5% lower than the previous rents in the same space as rental rates on new and renewed leasing rolled down to market rates. The renewal and relocation rate to expiring rate spread for the three months ended March 31, 2022 was 4.7% above expiring rates on 23,000 square feet of renewals.
- Tenant profile: As illustrated in the chart below, the Trust has a diversified and stable tenant mix.
See Figure 1, Estimated Annualized Gross Rental Revenue by Tenant Industry
Our top ten tenants make up approximately 38% of gross rental revenue, and 50% of our top tenants have credit ratings of A- or higher.
BUSINESS UPDATE
As at March 31, 2022, the Trust had approximately $280 million of available liquidity(6), $170 million of unencumbered assets(7) and a level of debt (net total debt-to-net total assets)(8) of 41.9%. As at March 31, 2022, the Trust had $2.6 billion of investment properties, $8.3 million of cash and cash equivalents, $271.3 million of undrawn credit facilities, $3.1 billion of total assets and $1.3 billion of total debt.
The novel coronavirus (“COVID-19”) pandemic continues to disrupt the Canadian economy. Repeated states of emergency and lockdowns as a result of emerging variants, most recently public health measures due to the Omicron variant in December 2021 and January 2022, have made it difficult for businesses to plan for the future. The full impact that these disruptions will have on the market for office space in the near term and the wider economy in general is unclear and difficult to predict. However, we believe that there will continue to be demand for high-quality and well-located office space in urban markets in Canada, especially in Toronto, when the economy normalizes. The Trust has ample financial resources to absorb near-term operational challenges and a program to drive value in the business through capital improvements and redevelopments to deliver best-in-class boutique office space to our tenants.
The COVID-19 pandemic delayed the construction timelines for the planned Bay Street corridor revitalization, but we are near completion of the interior renovation work, and façade improvements are scheduled to be finished this year. Since 2020, our successful redevelopment program has completed two projects on time and on budget that have significantly increased the value of the redeveloped properties and delivered significant incremental income to the Trust. 357 Bay Street in Toronto downtown was completed in Q4 2020 and in Q1 2022 contributed $3.0 million of annualized comparative properties NOI. Q3 2021 marked the completion of 1900 Sherwood Place in Regina, Saskatchewan, and the commencement of the 25-year Co-operators lease at the property. 1900 Sherwood Place generated $5.2 million of annualized NOI over Q1 2022. We are currently in the process of revitalizing 366 Bay Street in Toronto by fully modernizing the building’s systems, improving the building’s floorplates and upgrading the quality of the common areas. We are targeting a LEED Gold certification, among other certifications, as part of this development project. In addition, we have received zoning approval for 250 Dundas Street West in Toronto, have a zoning application underway for our property at Eglinton Avenue East and Birchmount Road in Scarborough, and are working on a development plan for 212 and 220 King Street West in Toronto.
We hold a stake in Dream Industrial REIT which continues to provide a meaningful contribution to our FFO as a result of the REIT’s successful European expansion and value-add strategy and the monthly distributions provide steady, predictable cash flow to the Trust at a time of uncertainty.
The effect of public health measures put in place as a response to the Omicron variant resulted in fewer property tours, lower building traffic and reduced parking lot utilization relative to Q4 2021. However, we believe that these effects are transitory and that the improvements in the latter half of 2021 will re-emerge during 2022.
During Q1 2022, the Trust executed leases totalling approximately 159,000 square feet across our portfolio. In Toronto downtown, the Trust executed 131,000 square feet of leases including the 54,000 square foot flexible workspace lease discussed previously. The remaining 78,000 square feet of leases were executed at a weighted average net rent of $32.07 per square foot, or 26.0% higher than the weighted average prior net rent per square foot on the same space, with a weighted average lease term of 5.2 years.
In the Other markets region we executed leases totalling 28,000 square feet at a weighted average net rent of $19.42 per square foot, an increase of 0.7% from the weighted average prior net rent on the same space, with a weighted average lease term of 7.2 years. To date, the Trust has secured commitments for approximately 659,000 square feet, or 82%, of 2022 full-year natural lease expiries, consistent with pre-COVID leasing trends. In Toronto downtown, 63,000 square feet, or approximately 1.8% of the region’s gross leaseable area, was being held intentionally vacant for retail repositioning and property improvement purposes as at March 31, 2022 of which the Trust has deals that were subsequently completed, are conditional or are in an advanced state of negotiation totalling 19,000 square feet.
Approximately 2% of the Trust’s total portfolio is currently sublet, with a weighted average in-place net rent of just over $25 per square foot.
The following table summarizes selected operational statistics with respect to the trailing four quarters and the month of April 2022 as at May 5, 2022, all presented as a percentage of recurring contractual gross rent:
| Cash | Deferral |
|
| collected | arrangements* | Outstanding |
Q2 2021 | 98.4% | 0.3% | 1.3% |
Q3 2021 | 98.5% | 0.2% | 1.3% |
Q4 2021 | 98.4% | —% | 1.6% |
Q1 2022 | 97.8% | —% | 2.2% |
April 2022 | 98.0% | 0.1% | 1.9% |
* Deferral arrangements are presented net of subsequently received cash receipts.
Over the course of the COVID-19 pandemic, we have worked collaboratively with our tenants to help them manage the challenges within their businesses and be set up for long-term success when the pandemic has passed. The Canadian Emergency Rent Subsidy program ended during Q4 2021 and the Hardest-Hit Business Recovery Program was introduced. While the new program is harder for tenants to qualify for, we have not seen any significant change in rent collection patterns since its introduction. In certain instances, the Trust has granted deferrals and rent repayment arrangements to select tenants on a case-by-case basis.
For the three months ended March 31, 2022, the Trust recorded COVID-related provisions totalling approximately $0.6 million which are included in the line item “COVID-related provisions and adjustments” within net rental income. These provision balances represent an estimate of potential credit losses on our trade receivables for all uncollected rent during the three months ended March 31, 2022.
CAPITAL HIGHLIGHTS
KEY FINANCIAL PERFORMANCE METRICS |
|
|
| As at |
(unaudited) |
| March 31, |
| December 31, |
|
| 2022 |
| 2021 |
Financing |
|
|
|
|
Weighted average face rate of interest on debt (period-end)(9) |
| 3.37% |
| 3.28% |
Interest coverage ratio (times)(10) |
| 2.9 |
| 3.0 |
Net total debt-to-normalized adjusted EBITDAFV ratio (years)(11) |
| 10.4 |
| 9.8 |
Level of debt (net total debt-to-net total assets)(8) |
| 41.9% |
| 41.8% |
Average term to maturity on debt (years) |
| 3.4 |
| 3.6 |
Undrawn credit facilities, available liquidity and unencumbered assets |
|
|
|
|
Undrawn credit facilities | $ | 271.3 | $ | 192.4 |
Available liquidity (in millions)(6) |
| 279.6 |
| 201.1 |
Unencumbered assets (in millions)(7) |
| 169.6 |
| 178.3 |
Capital (period-end) |
|
|
|
|
Total number of REIT A and LP B units (in millions)(12) |
| 52.3 |
| 53.3 |
Net asset value (“NAV”) per unit(13) | $ | 32.63 | $ | 31.49 |
See footnotes at end.
- Canada Infrastructure Bank Commercial Building Retrofit Initiative: On March 31, 2022, the Trust entered into an unsecured non-revolving credit facility and term credit facility with the Canada Infrastructure Bank under its Commercial Building Retrofit Initiative. Under the facility, the Canada Infrastructure Bank will lend the trust up to $112.9 million, representing 80% of the cost of commercial property retrofits in order to achieve certain energy efficiency savings and greenhouse gas (“GHG”) emission reductions. The non-revolving credit facility is available until the earlier of March 31, 2027 or the completion of all funded projects, at which point the aggregate drawings are converted to a 20-year amortizing term credit facility. During the five-year non-revolving credit facility period, the accumulated drawings bear interest at an annual fixed rate of 2.147%. Subsequent to conversion, the 20-year amortizing term credit facility will bear interest at an annual fixed rate between 1.0% and 3.0% determined at the time of conversion based on the assessed GHG emission reductions achieved in aggregate with the financed projects.
- Normal Course Issuer Bid (“NCIB”): For the three months ended March 31, 2022, the Trust purchased for cancellation 1,036,163 REIT A Units under the NCIB at a cost of $26.5 million. The Trust's current NCIB program is now complete.
- NAV per unit(13): As at March 31, 2022, our NAV per unit increased to $32.63 when compared to $31.49 at December 31, 2021. The increase in NAV per unit relative to December 31, 2021 was primarily due to cash flow retention (diluted FFO net of distributions), fair value gains on investment properties in Toronto downtown for four properties valued by qualified external valuation professionals, incremental income from our investment in Dream Industrial REIT and the effect of accretive unit repurchases under our NCIB program. As at March 31, 2021, equity per the condensed consolidated financial statements was $1.6 billion.
“Our partnership with the Canada Infrastructure Bank provides the Trust with a great source of capital to continue to improve our assets to a higher standard while doing our part to reduce greenhouse gas emissions in our portfolio,” said Jay Jiang, Chief Financial Officer of Dream Office REIT. “The facility will also enhance our liquidity and flexibility of our balance sheet so that we are able to reduce risk while remaining opportunistic.”
CONFERENCE CALL
Dream Office REIT holds semi-annual conference calls following the release of second and fourth quarter results.
OTHER INFORMATION
Information appearing in this press release is a selected summary of results. The condensed consolidated financial statements and Management’s Discussion and Analysis (“MD&A”) of the Trust are available at www.dreamofficereit.ca and on www.sedar.com.
Dream Office REIT is an unincorporated, open-ended real estate investment trust. Dream Office REIT is a premier office landlord in downtown Toronto with over 3.5 million square feet owned and managed. We have carefully curated an investment portfolio of high-quality assets in irreplaceable locations in one of the finest office markets in the world. We intend to enhance these properties to elevate their desirability to tenants and investors and improve the overall community experience. For more information, please visit our website at www.dreamofficereit.ca.
FOOTNOTES
(1) | Excludes joint ventures that are equity accounted at the end of each period. |
(2) | Excludes properties under development and joint ventures that are equity accounted at the end of each period. |
(3) | FFO is a non-GAAP financial measure. The most directly comparable financial measure to FFO is net income. The tables included in the Appendices section of this press release reconcile FFO for the three months ended March 31, 2022 and March 31, 2021 to net income. For further information on this non-GAAP measure please refer to the statements under the heading “Non-GAAP Financial Measures, Ratios and Supplementary Financial Measures” in this press release. |
(4) | Comparative properties NOI is a non-GAAP financial measure. The most directly comparable financial measure to comparative properties NOI is net rental income. The tables included in the Appendices section of this press release reconcile comparative properties NOI for the three months ended March 31, 2022 and March 31, 2021 to net rental income. For further information on this non-GAAP measure please refer to the statements under the heading “Non-GAAP Financial Measures, Ratios and Supplementary Financial Measures” in this press release. |
(5) | Diluted FFO per unit is a non-GAAP ratio. Diluted FFO per unit is calculated as FFO (a non-GAAP financial measure) divided by weighted average number of units. For further information on this non-GAAP ratio, please refer to the statements under the heading “Non-GAAP Financial Measures, Ratios and Supplementary Financial Measures” in this press release. A description of the determination of the weighted average number of units can be found in the Trust’s Management’s Discussion and Analysis for the three months ended March 31, 2022 in the section “Supplementary Financial Measures and Other Disclosures” under the heading “Weighted average number of units”. |
(6) | Available liquidity is a non-GAAP financial measure. The most directly comparable financial measure to available liquidity is undrawn credit facilities. The tables included in the Appendices section of this press release reconcile available liquidity to undrawn credit facilities as at March 31, 2022 and December 31, 2021. For further information on this non-GAAP financial measure please refer to the statements under the heading “Non-GAAP Financial Measures, Ratios and Supplementary Financial Measures” in this press release. |
(7) | Unencumbered assets is a supplementary financial measure. For further information on this supplementary financial measure, please refer to the statements under the heading “Non-GAAP Financial Measures, Ratios and Supplementary Financial Measures” in this press release. |
(8) | Level of debt (net total debt-to-net total assets) is a non-GAAP ratio. Net total debt-to-net total assets comprises net total debt (a non-GAAP financial measure) divided by net total assets (a non-GAAP financial measure). The tables in the appendices section reconcile net total debt and net total assets to total debt and total assets, respectively, as at March 31, 2022 and December 31, 2021. For further information on this non-GAAP ratio, please refer to the statements under the heading “Non-GAAP Financial Measures, Ratios and Supplementary Financial Measures” in this press release. |
(9) | Weighted average face rate of interest on debt is calculated as the weighted average face rate of all interest-bearing debt balances excluding debt in joint ventures that are equity accounted. |
(10) | Interest coverage ratio (times) is a non-GAAP ratio. Interest coverage ratio comprises trailing 12-month adjusted EBITDAFV divided by trailing 12-month interest expense on debt. Adjusted EBITDAFV, trailing 12-month Adjusted EBITDAFV and trailing 12-month interest expense on debt are non-GAAP measures. The tables in the Appendices section reconcile adjusted EBITDAFV to net income for the three months ended March 31, 2022 and March 31, 2021 and for the year ended December 31, 2021 and trailing 12-month adjusted EBITDAFV and trailing 12-month interest expense to adjusted EBITDAFV and interest expense, respectively, for the trailing 12-month period ended March 31, 2022. For further information on this non-GAAP ratio, please refer to the statements under the heading “Non-GAAP Financial Measures and Ratios and Supplementary Financial Measures” in this press release. |
(11) | Net total debt-to-normalized adjusted EBITDAFV ratio (years) is a non-GAAP ratio. Net total debt-to-normalized adjusted EBITDAFV comprises net total debt (a non-GAAP financial measure) divided by normalized adjusted EBITDAFV (a non-GAAP financial measure). Normalized adjusted EBITDAFV comprises adjusted EBITDAFV (a non-GAAP measure) adjusted for NOI from sold properties in the quarter. For further information on this non-GAAP ratio, please refer to the statements under the heading “Non-GAAP Financial Measures and Ratios and Supplementary Financial Measures” in this press release. |
(12) | Total number of REIT A and LP B units includes 5.2 million LP B Units which are classified as a liability under IFRS. |
(13) | NAV per unit is a non-GAAP ratio. NAV per unit is calculated as Total equity (including LP B Units) divided by the total number of REIT A and LP B units outstanding as at the end of the period. Total equity (including LP B Units) is a non-GAAP measure. The most directly comparable financial measure to total equity (including LP B Units) is equity. The tables included in the appendices section of this press release reconcile total equity (including LP B Units) to equity as at March 31, 2022 and December 31, 2021. For further information on this non-GAAP measure please refer to the statements under the heading “Non-GAAP Financial Measures, Ratios and Supplementary Financial Measures” in this press release. |
NON-GAAP FINANCIAL MEASURES, RATIOS AND SUPPLEMENTARY FINANCIAL MEASURES
The Trust’s condensed consolidated financial statements are prepared in accordance with International Financial Reporting Standards (“IFRS”). In this press release, as a complement to results provided in accordance with IFRS, the Trust discloses and discusses certain non-GAAP financial measures, including FFO, comparative properties NOI and available liquidity, and non-GAAP ratios, including diluted FFO per unit, level of debt (net total debt-to-net total assets), interest coverage ratio, net total debt-to-normalized adjusted EBITDAFV and NAV per unit, as well as other measures discussed elsewhere in this release. These measures and ratios are not standardized financial measures under IFRS and might not be comparable to similar financial measures disclosed by other issuers. The Trust has presented such non-GAAP measures and non-GAAP ratios as Management believes they are relevant measures of the Trust’s underlying operating and financial performance. Certain additional disclosures such as the composition, usefulness and changes, as applicable, of the non-GAAP financial measures and ratios included in this press release have been incorporated by reference from the management’s discussion and analysis of the financial condition and results from operations of the Trust for the three months ended March 31, 2022, dated May 5, 2022 (the “MD&A for the first quarter of 2022”) and can be found under the section “Non-GAAP Financial Measures and Ratios" and respective sub-headings labelled “Funds from operations and diluted FFO per unit”, "Comparative properties NOI”, “Level of debt (net total debt-to-net total assets)”, “Net total debt-to-normalized adjusted EBITDAFV ratio (years)”, “Interest coverage ratio”, “Available liquidity” and “Net asset value (“NAV”) per Unit”. The composition of supplementary financial measures included in this press release have been incorporated by reference from the MD&A for the first quarter of 2022 and can be found under the section “Supplementary financial measures and ratios and other disclosures”. The MD&A for the first quarter of 2022 is available on SEDAR at www.sedar.com under the Trust’s profile and on the Trust’s website at www.dreamofficereit.ca under the Investors section. Non-GAAP measures should not be considered as alternatives to net income, net rental income, cash flows generated from (utilized in) operating activities, cash and cash equivalents, total assets, non-current debt, total equity, or comparable metrics determined in accordance with IFRS as indicators of the Trust’s performance, liquidity, leverage, cash flow, and profitability. Reconciliations to the nearest comparable financial measure are contained at the end of this press release.
FORWARD-LOOKING INFORMATION
This press release may contain forward-looking information within the meaning of applicable securities legislation, including, but not limited to, statements regarding our objectives and strategies to achieve those objectives, our ability to increase the desirability, occupancy and liquidity of our buildings; the effect of building improvements on tenant experience and building quality and performance; our expectations regarding the COVID-19 pandemic and the timing of current and prospective tenants’ return to the office and its effect on our business and financial metrics, including in respect of leasing, building traffic and our revenues; our expectations regarding future demand for office space in urban markets in Canada; our ability to achieve building certifications; anticipated financial performance of tenants with percentage rent arrangements; our development, redevelopment and intensification plans and timelines, and the effect of these plans on the value and quality of our portfolio; our future capital requirements and ability to meet those requirements; our asset management strategies and prospective leasing activity and our overall financial performance, profitability and liquidity for future periods and years. Forward-looking statements generally can be identified by words such as “outlook”, “objective”, “may”, “will”, “would”, “expect”, “intend”, “estimate”, “anticipate”, “believe”, “should”, “could”, “likely”, “plan”, “project”, “budget”, or “continue” or similar expressions suggesting future outcomes or events. Forward-looking information is based on a number of assumptions and is subject to a number of risks and uncertainties, many of which are beyond Dream Office REIT’s control, which could cause actual results to differ materially from those that are disclosed in or implied by such forward-looking information. These risks and uncertainties include, but are not limited to, general and local economic and business conditions; the impact of the COVID-19 pandemic on the Trust; the effect of government restrictions on leasing and building traffic; employment levels; mortgage and interest rates and regulations; the uncertainties around the timing and amount of future financings; leasing risks, including those associated with the ability to lease vacant space; rental rates on future leasing; and interest and currency rate fluctuations. Our objectives and forward-looking statements are based on certain assumptions, including that the general economy remains stable, interest rates remain stable, conditions within the real estate market remain consistent, that government restrictions due to COVID-19 on the ability of us and our tenants to operate their businesses at our properties will continue to ease and will not be re-imposed in any material respects, competition for acquisitions remains consistent with the current climate, and that the capital markets continue to provide ready access to equity and/or debt. All forward-looking information in this press release speaks as of the date of this press release. Dream Office REIT does not undertake to update any such forward-looking information whether as a result of new information, future events or otherwise except as required by law. Additional information about these assumptions and risks and uncertainties is contained in Dream Office REIT’s filings with securities regulators, including its latest annual information form and MD&A. These filings are also available at Dream Office REIT’s website at www.dreamofficereit.ca.
APPENDICES
Funds from operations and diluted FFO per unit
|
| Three months ended March 31, | ||||
|
|
| 2022 |
|
| 2021 |
Net income for the period |
| $ | 52,282 |
| $ | 10,146 |
Add (deduct): |
|
|
|
|
|
|
Share of net income from investment in Dream Industrial REIT |
|
| (42,899) |
|
| (13,950) |
Share of FFO from investment in Dream Industrial REIT |
|
| 5,847 |
|
| 5,034 |
Depreciation and amortization |
|
| 2,986 |
|
| 3,079 |
Costs (recovery) attributable to sale of investment properties(1) |
|
| (12) |
|
| 1,074 |
Interest expense on subsidiary redeemable units |
|
| 1,308 |
|
| 1,308 |
Fair value adjustments to investment properties |
|
| (19,379) |
|
| 6,139 |
Fair value adjustments to investment properties held in joint ventures |
|
| (23) |
|
| (13) |
Fair value adjustments to financial instruments and DUIP included in G&A expenses |
|
| 20,340 |
|
| 8,026 |
Internal leasing costs |
|
| 517 |
|
| 390 |
Principal repayments on finance lease liabilities |
|
| (13) |
|
| (12) |
Deferred income taxes expense (recovery) |
|
| 89 |
|
| 88 |
FFO for the period | $ | 21,043 |
| $ | 21,309 | |
Diluted weighted average number of units(2) |
|
| 53,688 |
|
| 56,768 |
FFO per unit – diluted |
| $ | 0.39 |
| $ | 0.38 |
(1) | Includes both continuing and discontinued operations. | |
(2) | Diluted weighted average number of units includes the weighted average of all REIT A Units, LP B Units, vested but unissued and unvested deferred trust units and associated income deferred trust units. |
Comparative properties NOI
| Three months ended |
Change
|
Change
| |||||||||||
| March 31, |
| March 31, |
|
| Change | ||||||||
| 2022 |
| 2021 |
|
| Amount |
| % | ||||||
Toronto downtown | $ | 21,630 |
| $ | 23,511 |
| $ | (1,881) |
| (8.0) |
| (8.2) |
| 3.4 |
Other markets |
| 5,690 |
|
| 5,199 |
|
| 491 |
| 9.4 |
| 4.3 |
| (4.0) |
Comparative properties NOI |
| 27,320 |
|
| 28,710 |
|
| (1,390) |
| (4.8) |
| (3.9) |
| 0.5 |
1900 Sherwood Place |
| 1,289 |
|
| 10 |
|
| 1,279 |
|
|
|
|
|
|
Property under development |
| (55) |
|
| (43) |
|
| (12) |
|
|
|
|
|
|
Property management and other service fees |
| 431 |
|
| 326 |
|
| 105 |
|
|
|
|
|
|
COVID-related provisions and adjustments |
| (602) |
|
| 169 |
|
| (771) |
|
|
|
|
|
|
Straight-line rent |
| 129 |
|
| 27 |
|
| 102 |
|
|
|
|
|
|
Amortization of lease incentives |
| (2,902) |
|
| (2,930) |
|
| 28 |
|
|
|
|
|
|
Lease termination fees and other |
| 253 |
|
| (28) |
|
| 281 |
|
|
|
|
|
|
Sold properties |
| — |
|
| 30 |
|
| (30) |
|
|
|
|
|
|
Net rental income from continuing operations | $ | 25,863 |
| $ | 26,271 |
| $ | (408) |
|
|
|
|
|
|
Available liquidity
|
| As at | |||
|
| March 31, |
| December 31, | |
|
| 2022 |
| 2021 | |
Undrawn credit facilities | $ | 271,337 | $ | 192,355 | |
Cash and cash equivalents |
| 8,302 |
| 8,763 | |
Available liquidity | $ | 279,639 | $ | 201,118 | |
Level of debt (net total debt-to-net total assets)
| Amounts included in condensed consolidated financial statements | ||||
| March 31, |
| December 31, | ||
|
| 2022 |
|
| 2021 |
Non-current debt | $ | 1,236,423 |
| $ | 1,206,734 |
Current debt |
| 79,203 |
|
| 76,539 |
Total debt |
| 1,315,626 |
|
| 1,283,273 |
Less: Cash on hand |
| (6,627) |
|
| (5,556) |
Net total debt | $ | 1,308,999 |
| $ | 1,277,717 |
Total assets |
| 3,127,608 |
|
| 3,065,560 |
Less: Cash on hand |
| (6,627) |
|
| (5,556) |
Net total assets | $ | 3,120,981 |
| $ | 3,060,004 |
Net total debt-to-net total assets |
| 41.9% |
|
| 41.8% |
Adjusted EBITDAFV
| Three months ended |
| Year ended | |||||
| March 31, |
| March 31, |
| December 31, | |||
|
| 2022 |
|
| 2021 |
|
| 2021 |
Net income for the period | $ | 52,282 |
| $ | 10,146 |
| $ | 154,207 |
Add (deduct): |
|
|
|
|
|
|
|
|
Interest – debt |
| 11,259 |
|
| 10,884 |
|
| 43,372 |
Interest – subsidiary redeemable units |
| 1,308 |
|
| 1,308 |
|
| 5,234 |
Current and deferred income taxes expense (recovery), net |
| 124 |
|
| 88 |
|
| (203) |
Depreciation on property and equipment |
| 130 |
|
| 242 |
|
| 897 |
Fair value adjustments to investment properties |
| (19,379) |
|
| 6,139 |
|
| (47,926) |
Fair value adjustments to financial instruments |
| 20,282 |
|
| 8,152 |
|
| 29,922 |
Share of net income from investment in Dream Industrial REIT |
| (42,899) |
|
| (13,950) |
|
| (90,645) |
Distributions received from Dream Industrial REIT |
| 4,655 |
|
| 4,655 |
|
| 18,622 |
Share of net loss from investment in joint ventures |
| 72 |
|
| 16 |
|
| 340 |
Non-cash items included in investment properties revenue(1) |
| 2,773 |
|
| 2,903 |
|
| 11,217 |
Government assistance and COVID-related provisions |
| 602 |
|
| (169) |
|
| 482 |
Lease termination fees and other |
| (253) |
|
| 28 |
|
| (836) |
Net losses (gains) on transactions and other items(2) |
| 505 |
|
| 1,464 |
|
| 3,732 |
Adjusted EBITDAFV for the period | $ | 31,461 |
| $ | 31,906 |
| $ | 128,415 |
(1) | Includes adjustments for straight-line rent and amortization of lease incentives. | |
(2) | Includes both continuing and discontinued operations. |
Trailing 12-month Adjusted EBITDAFV and trailing 12-month interest expense on debt
| Trailing 12-month period | ||
| ended March 31, 2022 | ||
Adjusted EBITDAFV for the three months ended March 31, 2022 |
| $ | 31,461 |
Add: Adjusted EBITDAFV for the year ended December 31, 2021 |
|
| 128,415 |
Less: Adjusted EBITDAFV for the three months ended March 31, 2021 |
|
| (31,906) |
Trailing 12-month Adjusted EBITDAFV |
| $ | 127,970 |
| Trailing 12-month period | ||
| ended March 31, 2022 | ||
Interest expense on debt for the three months ended March 31, 2022 |
| $ | 11,259 |
Add: Interest expense on debt for the year ended December 31, 2021 |
|
| 43,372 |
Less: Interest expense on debt for the three months ended March 31, 2021 |
|
| (10,884) |
Trailing 12-month interest expense on debt |
| $ | 43,747 |
Interest coverage ratio (times)
| For the trailing 12-month period ended | ||||
| March 31, |
|
| December 31, | |
| 2022 |
|
| 2021 | |
Trailing 12-month Adjusted EBITDAFV | $ | 127,970 |
| $ | 128,415 |
Interest expense on debt | $ | 43,747 |
| $ | 43,372 |
Interest coverage ratio (times) |
| 2.9 |
|
| 3.0 |
Net total debt-to-normalized adjusted EBITDAFV ratio (years)
| March 31, | December 31, | |||
|
| 2022 |
| 2021 | |
Non-current debt |
| $ | 1,236,423 | $ | 1,206,734 |
Current debt |
|
| 79,203 |
| 76,539 |
Total debt |
|
| 1,315,626 |
| 1,283,273 |
Less: Cash on hand(1) |
|
| (6,627) |
| (5,556) |
Net total debt |
| $ | 1,308,999 | $ | 1,277,717 |
Adjusted EBITDAFV – quarterly |
|
| 31,461 |
| 32,534 |
Less: NOI of disposed properties for the quarter |
|
| — |
| (4) |
Normalized adjusted EBITDAFV – quarterly |
| $ | 31,461 | $ | 32,530 |
Normalized adjusted EBITDAFV – annualized |
| $ | 125,844 | $ | 130,120 |
Net total debt-to-normalized adjusted EBITDAFV ratio (years) |
|
| 10.4 |
| 9.8 |
(1) | Cash on hand represents cash on hand at period-end, excluding cash held in co-owned properties and joint ventures that are equity accounted. |
NAV per unit
|
|
| Unitholders’ equity | ||||||||
|
|
| March 31, 2022 |
| December 31, 2021 | ||||||
|
|
| Number of Units |
|
| Amount |
| Number of Units |
|
| Amount |
Unitholders’ equity |
|
| 47,029,715 |
| $ | 1,857,974 |
| 48,034,754 |
| $ | 1,883,653 |
Deficit |
|
| — |
|
| (298,149) |
| — |
|
| (338,593) |
Accumulated other comprehensive income (loss) |
|
| — |
|
| (347) |
| — |
|
| 3,268 |
Equity per condensed consolidated financial statements | 47,029,715 |
|
| 1,559,478 |
| 48,034,754 |
|
| 1,548,328 | ||
Add: LP B Units |
|
| 5,233,823 |
|
| 145,867 |
| 5,233,823 |
|
| 128,909 |
Total equity (including LP B Units) |
|
| 52,263,538 |
| $ | 1,705,345 |
| 53,268,577 |
| $ | 1,677,237 |
NAV per unit |
|
|
|
| $ | 32.63 |
|
|
| $ | 31.49 |
View source version on businesswire.com: https://www.businesswire.com/news/home/20220505005870/en/


