
As a chart is worth more than a thousand words, you'll find a few illustrations below. The white line represents the dollar index, while the blue line corresponds to the performance of the S&P 500. As you can see from recent history, the dollar is a slightly leading indicator of reversals in the US market.
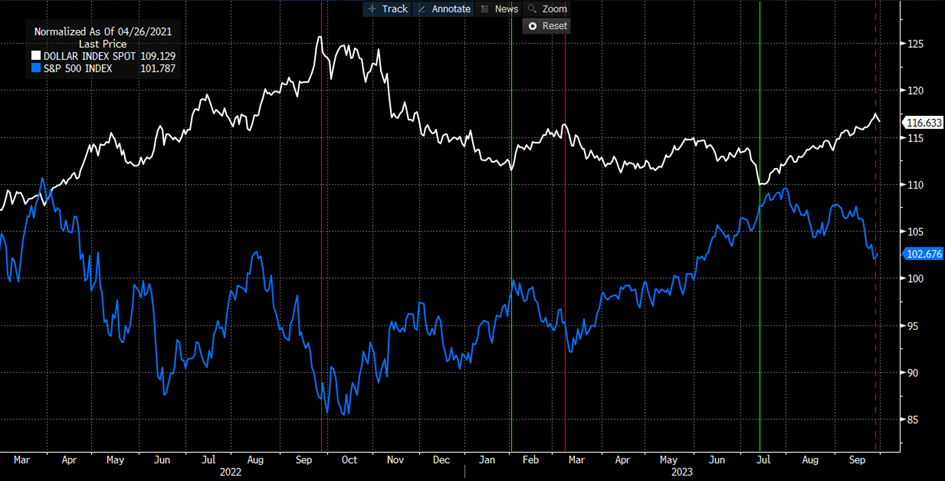
Source : Bloomberg
Saloon door
On closer inspection, the structure of the dollar index may well resemble a saloon door! You'll have to use your imagination, so I'll try to explain. According to Dow's theory, a bear market is characterized by a succession of lower and lower lows and lower and lower highs. A trend-following strategy therefore consists in selling a market when a low point is reached, by placing a protective stop on the previous high. If we take the case of the dollar index, this would have resulted in a short sale on breaking 100.82, with a stop above the May highs at 104.70. However, after effectively breaching support, the dollar turned upwards, taking sellers by surprise. The risk is identical on the upside: as long as 107.10/107.80 are not breached, it is perfectly possible to have a replica of the previous movement: buyers enter a "breakout" before seeing the market turn downwards. We'll be keeping a close eye on the resistance zone to avoid being trapped, while considering that a break of 104.70 will confirm this "saloon door" formation!
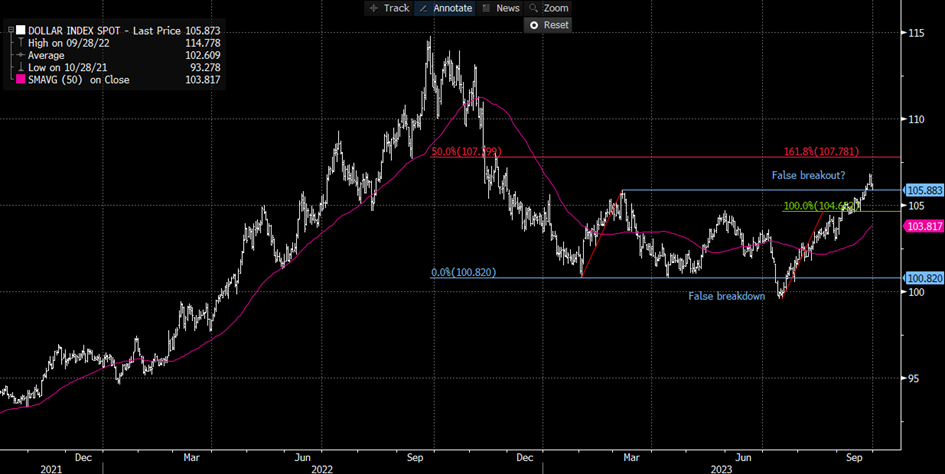
Source : Bloomberg
Alongside 107.10/107.80, keep an eye on 1.0460/1.0430 on the EURUSD, with resistance at 1.0760, the DXY's counterpart to 104.70.
In the commodity currencies, the NZDUSD has managed to break out of its 0.587-0.5974 accumulation at the top, paving the way for a recovery towards 0.6106 or even 0.6244. This configuration is also encouraging for the AUDUSD which, although still locked in a narrow consolidation band between 0.6486 and 0.6374/48, is in a good position to follow the kiwi with 0.6573 as its first target.
To conclude this overview with the scandies, we note that the EURSEK is close to major support at 11.40, a break of which would validate a double-top reversal pattern with a potential of 10.80. EURNOK isn't doing much better: after validating a head-and-shoulders reversal pattern in mid-July, it remains under downward pressure as long as 11.60 is resistance.


