Talking Points
- USD/JPY closes over important Gann level
- Gold lacks direction
- Turn window in USD/CAD
Get real time volume on your charts for free. Click HERE
Foreign Exchange Price & Time at a Glance:
Price & Time Analysis: USD/JPY
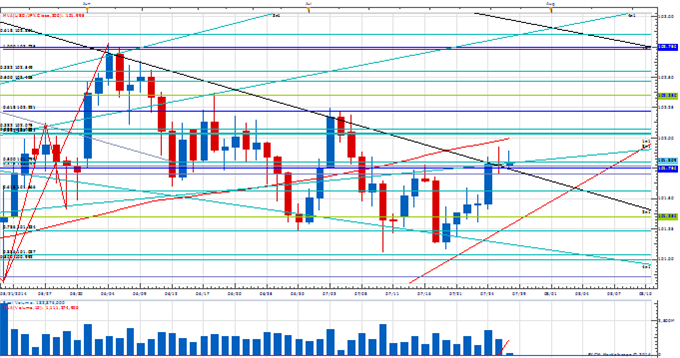
Charts Created using Marketscope – Prepared by Kristian Kerr
- USD/JPY closed above the 101.80 2x1 Gann angle line of the year’s high on Friday (the first time since early April)
- Our near-term trend bias is higher in the exchange rate while over 101.05
- A daily close over 102.25 is needed to confirm the start of a more serious advance
- A minor cycle turn window is eyed mid-week
- Weakness below 101.05 would undermine the burgeoning positive technical structure
USD/JPY Strategy: Like buying USD/JPY on a move through 102.25.
Instrument | Support 2 | Support 1 | Spot | Resistance 1 | Resistance 2 |
USD/JPY | *101.05 | 101.35 | 101.80 | 102.00 | *102.25 |
Price & Time Analysis: GOLD
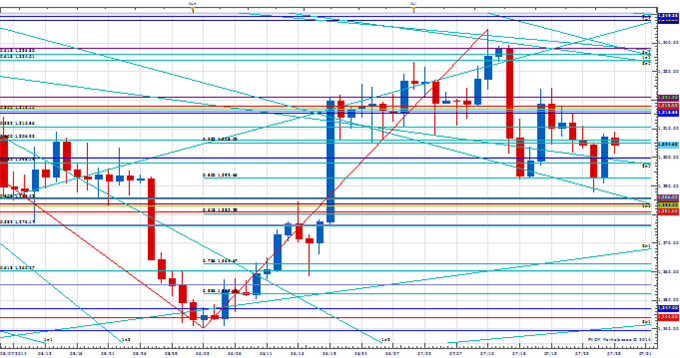
Charts Created using Marketscope – Prepared by Kristian Kerr
- XAU/USD has come under steady pressure over the past couple of weeks
- Our near-term trend bias is lower in the metal while below 1321
- A close under 1281 is needed to instill any sort of negative momentum
- A cycle turn window is seen next week
- Strength back through 1321 would turn us positive on Gold
XAU/USD Strategy: Square here.
Instrument | Support 2 | Support 1 | Spot | Resistance 1 | Resistance 2 |
XAU/USD | 1266 | *1281 | 1305 | *1321 | 1338 |
Focus Chart of the Day: USD/CAD
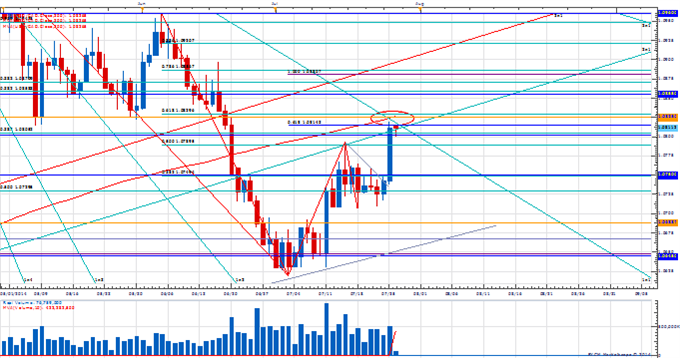
We should learn a lot about the true intentions of the current move higher in USD/CAD over the next day or two. Our cyclical analysis suggests that if the rebound off the key support confluence area around 1.0650 has just been corrective then the exchange rate should turn back down around this time. Interestingly (as the chart above shows) this key moment in time is occurring right around an almost equally important price zone as the 200-day moving average, 2nd square root relationship of the month-to-date low, 1x1 Gann angle line of the year’s high and 61.8% retracement of the June decline all converge around 1.0820/30. If the pair is turning back down then these levels should probably hold. Strength through them (especially after Tuesday) would signal the move higher in USD/CAD has a lot more to run.
To receive Kristian’s analysis directly via email, please SIGN UP HERE.
This publication attempts to further explore the concept that mass movements of human psychology, as represented by the financial markets, are subject to the mathematical laws of nature and through the use of various geometric, arithmetic, statistical and cyclical techniques a better understanding of markets and their corresponding movements can be achieved.
--- Written by Kristian Kerr, Senior Currency Strategist for DailyFX.com
To contact Kristian, e-mail kkerr@fxcm.com. Follow me on Twitter @KKerrFX
original source


