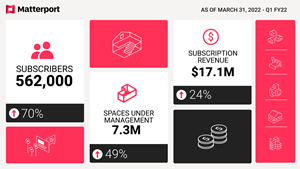
- Total subscribers increased 70% to 562,000 from year-ago period
- Subscription revenue rose 24% year-over-year
- Q1 GAAP diluted earnings per share of
$0.23 , Non-GAAP loss per share of$0.10 - Company reaffirms prior guidance for the full year
- Balance sheet remains strong with
$600 million cash and investments and no debt
“We are pleased to report another strong quarter, increasing our subscriber count by 70% to 562,000 subscribers for the period. We expanded Spaces Under Management by 49% to 7.3 million spaces — that’s 7.3 million
“In addition to strong adoption, we are excited to report our total revenue for the first quarter of 2022 was
First Quarter 2022 Financial Highlights
- Total revenue was
$28.5 million , up 6% compared to first quarter of 2021 - Subscription revenue was
$17.1 million , up 24% compared to first quarter of 2021 - Annualized Recurring Revenue (ARR) of
$68.6 million - Total subscribers increased to 562,000, up 70% compared to first quarter of 2021
- Spaces Under Management (SUM) grew to 7.3 million, up 49% compared to first quarter of 2021
Recent Business Highlights
- Matterport Axis™, a motorized mount for smartphones, is now available for purchase. Matterport Axis, which holds either an iOS or Android device, and can be used with the Matterport Capture app, creates 3D digital twins of any physical space with increased speed, precision, and consistency
- Announced Midland Holdings, one of the largest residential real estate brokerages in the
Greater China region, will become the first brokerage in the region to useMatterport digital twins to create virtual 3D experiences for its entire portfolio of properties - Expanded its presence in the Brazilian market via two strategic partners, Guandalini Posicionamento and PARS, to offer
Matterport's spatial data platform to their enterprise customers in the architecture, engineering, and construction (AEC) markets. - Announced and completed the acquisition of
Enview, Inc. , a pioneer in the scalable, artificial intelligence (AI) for 3D spatial data - Announced the redemption of public warrants, resulting in approximately
$104 million in cash proceeds from the warrants prior to redemption - Launched social impact program to support nonprofits and public education institutions by enabling equitable access to 3D spaces
- Won two Comparably Awards, including Best Company Outlook among small/mid-sized companies and Best Places to Work in the
San Francisco Bay Area - Strengthened Matterport’s executive team through the addition of the following executives:
Tom Klein , Chief Marketing OfficerDeepti Illa , Vice President, Global Integrated MarketingAli Jayson , Vice President, Product MarketingFlorence Shaffer , Vice President, Strategy & Operations, Chief of Staff to CEOBen Corser , Managing Director,Asia Pacific Rob Hines , Managing Director,Americas
Full Year and Second Quarter 2022 Outlook
| Q2 2022 Guidance | FY 2022 Guidance | |
| Revenue (in millions) | ||
| Subscription Revenue (in millions) | ||
| Year-over-year Subscription Revenue growth | 18% - 20% | 31% - 34% |
| Non-GAAP loss per share | ( | ( |
| Fully diluted shares outstanding (in millions) | 284 | 285 |
Non-GAAP Financial Information
The presentation of these non-GAAP financial measures are not meant to be considered in isolation or as a substitute for comparable GAAP financial measures and should be read only in conjunction with the Company’s consolidated financial statements prepared in accordance with GAAP. For further information regarding these non-GAAP measures, including the reconciliation of these non-GAAP financial measures to their most directly comparable GAAP financial measures, please refer to the financial tables below.
Non-GAAP Net Loss and Non-GAAP Net Loss Per Share, Basic and Diluted.
Conference Call Information
About
©2022
Forward-Looking Statements
This press release contains certain forward-looking statements within the meaning of the federal securities laws, including statements regarding the services offered by
Forward-looking statements are predictions, projections and other statements about future events that are based on current expectations and assumptions and, as a result, are subject to risks and uncertainties. Many factors could cause actual future events to differ materially from the forward-looking statements in this document, including Matterport’s ability to implement business plans, forecasts, and other expectations in the industry in which
Investor Contact:
VP, Investor Relations
ir@matterport.com
Media Contact:
Director, Communications
press@matterport.com
+1 (650) 273-6999
CONDENSED CONSOLIDATED STATEMENTS OF OPERATIONS
(In thousands, except per share data)
(Unaudited)
| Three Months Ended | |||||||
| 2022 | 2021 | ||||||
| Revenue: | |||||||
| Subscription | $ | 17,141 | $ | 13,800 | |||
| License | 23 | 2,260 | |||||
| Services | 3,973 | 2,689 | |||||
| Product | 7,373 | 8,180 | |||||
| Total revenue | 28,510 | 26,929 | |||||
| Costs of revenue: | |||||||
| Subscription | 5,262 | 3,251 | |||||
| License | — | — | |||||
| Services | 2,983 | 2,035 | |||||
| Product | 8,356 | 4,915 | |||||
| Total costs of revenue | 16,601 | 10,201 | |||||
| Gross profit | 11,909 | 16,728 | |||||
| Operating expenses: | |||||||
| Research and development | 26,002 | 6,025 | |||||
| Selling, general, and administrative | 70,849 | 13,058 | |||||
| Total operating expenses | 96,851 | 19,083 | |||||
| Loss from operations | (84,942 | ) | (2,355 | ) | |||
| Other income (expense): | |||||||
| Interest income | 1,295 | 8 | |||||
| Interest expense | — | (308 | ) | ||||
| Change in fair value of warrants liabilities | 21,433 | — | |||||
| Change in fair value of contingent earn-out liability | 136,043 | — | |||||
| Other expense, net | (1,321 | ) | (198 | ) | |||
| Total other income (expense) | 157,450 | (498 | ) | ||||
| Income (loss) before provision for income taxes | 72,508 | (2,853 | ) | ||||
| Provision for income taxes | 604 | 19 | |||||
| Net income (loss) | $ | 71,904 | $ | (2,872 | ) | ||
| Net income (loss) per share attributable to common stockholders: | |||||||
| Basic | $ | 0.26 | $ | (0.07 | ) | ||
| Diluted | $ | 0.23 | $ | (0.07 | ) | ||
| Weighted-average shares used in computing net income (loss) per share attributable to common stockholders: | |||||||
| Basic | 275,199 | 39,632 | |||||
| Diluted | 312,432 | 39,632 | |||||
CONDENSED CONSOLIDATED BALANCE SHEETS
(In thousands)
(Unaudited)
| 2022 | 2021 | ||||||
| ASSETS | |||||||
| Current assets: | |||||||
| Cash and cash equivalents | $ | 92,996 | $ | 139,519 | |||
| Restricted cash | — | 468 | |||||
| Short-term investments | 308,813 | 264,931 | |||||
| Accounts receivable, net | 15,088 | 10,879 | |||||
| Inventories | 5,166 | 5,593 | |||||
| Prepaid expenses and other current assets | 14,213 | 16,313 | |||||
| Total current assets | 436,276 | 437,703 | |||||
| Property and equipment, net | 21,946 | 14,118 | |||||
| Operating lease right-of-use assets | 3,369 | — | |||||
| Long-term investments | 198,178 | 263,659 | |||||
| 54,080 | — | ||||||
| Intangible assets, net | 5,140 | — | |||||
| Other assets | 2,912 | 3,696 | |||||
| Total assets | $ | 721,901 | $ | 719,176 | |||
| LIABILITIES AND STOCKHOLDERS’ EQUITY | |||||||
| Current liabilities | |||||||
| Accounts payable | $ | 13,089 | $ | 12,227 | |||
| Deferred revenue | 14,270 | 11,074 | |||||
| Accrued expenses and other current liabilities | 21,763 | 10,026 | |||||
| Total current liabilities | 49,122 | 33,327 | |||||
| Warrants liability | 6,405 | 38,974 | |||||
| Contingent earn-out liability | — | 377,576 | |||||
| Deferred revenue, non-current | 288 | 874 | |||||
| Other long-term liabilities | 6,448 | 262 | |||||
| Total liabilities | 62,263 | 451,013 | |||||
| Commitments and contingencies | |||||||
| Redeemable convertible preferred stock | $ | — | $ | — | |||
| Stockholders’ equity: | |||||||
| Common stock | 28 | 25 | |||||
| Additional paid-in capital | 1,061,938 | 737,735 | |||||
| Accumulated other comprehensive loss | (6,174 | ) | (1,539 | ) | |||
| Accumulated deficit | (396,154 | ) | (468,058 | ) | |||
| Total stockholders’ equity | 659,638 | 268,163 | |||||
| Total liabilities and stockholders’ equity | $ | 721,901 | $ | 719,176 | |||
CONDENSED CONSOLIDATED STATEMENTS OF CASH FLOWS
(In thousands, unaudited)
| Three Months Ended | |||||||
| 2022 | 2021 | ||||||
| CASH FLOWS FROM OPERATING ACTIVITIES | |||||||
| Net income (loss) | $ | 71,904 | $ | (2,872 | ) | ||
| Adjustments to reconcile net income (loss) to net cash provided by (used in) operating activities: | |||||||
| Depreciation and amortization | 2,463 | 1,285 | |||||
| Amortization of debt discount | — | 67 | |||||
| Amortization of investment premiums, net of accretion of discounts | 954 | — | |||||
| Stock-based compensation, net of amounts capitalized | 55,277 | 658 | |||||
| Change in fair value of warrants liabilities | (21,433 | ) | — | ||||
| Change in fair value of contingent earn-out liability | (136,043 | ) | — | ||||
| Deferred income taxes | (227 | ) | — | ||||
| Allowance for doubtful accounts | 191 | 16 | |||||
| Other | 45 | (53 | ) | ||||
| Changes in operating assets and liabilities, net of effects of businesses acquired: | |||||||
| Accounts receivable | (3,988 | ) | (722 | ) | |||
| Inventories | 427 | 185 | |||||
| Prepaid expenses and other assets | (1,571 | ) | (144 | ) | |||
| Accounts payable | 659 | 1,869 | |||||
| Deferred revenue | 2,610 | 1,787 | |||||
| Accrued expenses and other liabilities | 3,254 | (1,020 | ) | ||||
| Net cash provided by (used in) operating activities | (25,478 | ) | 1,056 | ||||
| CASH FLOWS FROM INVESTING ACTIVITIES: | |||||||
| Purchases of property and equipment | (448 | ) | (162 | ) | |||
| Capitalized software and development costs | (3,596 | ) | (1,344 | ) | |||
| Purchase of investments | (30,378 | ) | — | ||||
| Maturities of investments | 46,200 | — | |||||
| Investment in convertible notes | — | (1,000 | ) | ||||
| Business acquisitions, net of cash acquired | (30,020 | ) | — | ||||
| Net cash used in investing activities | (18,242 | ) | (2,506 | ) | |||
| CASH FLOW FROM FINANCING ACTIVITIES: | |||||||
| Payment of transaction costs related to reverse recapitalization | — | (593 | ) | ||||
| Proceeds from exercise of stock options | 2,191 | 789 | |||||
| Payments for taxes related to net settlement of equity awards | (33,337 | ) | — | ||||
| Proceeds from exercise of warrants | 27,844 | — | |||||
| Repayment of debt | — | (1,099 | ) | ||||
| Other | 76 | — | |||||
| Net cash used in financing activities | (3,226 | ) | (903 | ) | |||
| Net change in cash, cash equivalents, and restricted cash | (46,946 | ) | (2,353 | ) | |||
| Effect of exchange rate changes on cash | (45 | ) | (12 | ) | |||
| Cash, cash equivalents, and restricted cash at beginning of year | 139,987 | 52,250 | |||||
| Cash, cash equivalents, and restricted cash at end of period | $ | 92,996 | $ | 49,885 | |||
RECONCILIATION OF GAAP TO NON-GAAP FINANCIAL MEASURES
(In thousands, except per share amounts)
(unaudited)
| Three Months Ended | ||||||||
| 2022 | 2021 | |||||||
| GAAP net income/(loss) | $ | 71,904 | $ | (2,872 | ) | |||
| Stock-based compensation expense (1) | 56,088 | 658 | ||||||
| Acquisition-related costs (2) | 172 | — | ||||||
| Amortization expense of acquired intangible assets | 260 | — | ||||||
| Change in fair value of warrants liabilities (3) | (21,433 | ) | — | |||||
| Change in fair value of contingent earn-out liability (4) | (136,043 | ) | — | |||||
| Payroll tax related to contingent earn-out share issuance (5) | 1,164 | — | ||||||
| Non-GAAP net loss | $ | (27,888 | ) | $ | (2,214 | ) | ||
| GAAP net income (loss) per share attributable to common stockholders: | ||||||||
| Basic | $ | 0.26 | $ | (0.07 | ) | |||
| Diluted | $ | 0.23 | $ | (0.07 | ) | |||
| Non-GAAP net loss per share attributable to common stockholders, basic and diluted | $ | (0.10 | ) | $ | (0.01 | ) | ||
| GAAP weighted-average shares used to compute net income (loss) per share, basic | 275,199 | 39,632 | ||||||
| Weighted-average effect of potentially dilutive securities (6) | 37,233 | — | ||||||
| GAAP weighted-average shares used to compute net income (loss) per share, diluted | 312,432 | 39,632 | ||||||
| Excluded anti-dilutive weighted-average potential shares of common stock in calculating non-GAAP loss per share | (37,233 | ) | — | |||||
| Adjustment for common stock issued in connection with the merger (7) | — | 127,499 | ||||||
| Non-GAAP weighted-average shares used to compute net loss per share, basic and diluted | 275,199 | 167,131 | ||||||
(1) Consists primarily of non-cash share-based compensation related to the Company's stock incentive plans and earn-out arrangement.
(2) Consists of acquisition transaction costs.
(3) Consists of the non-cash fair value measurement change for public and private warrants.
(4) Represents the non-cash fair-value measurement change related to our earn-out liability.
(5) Represents the payroll tax related to Earn-out shares issuance and release.
(6) Consists of the potentially dilutive effect of employee equity incentive plan awards.
(7) Consists of non-GAAP adjustment of unweighted average common stock issued and converted from
A photo accompanying this announcement is available at
A photo accompanying this announcement is available at https://www.globenewswire.com/NewsRoom/AttachmentNg/4034e15b-6368-40be-95e9-26432d54e28c

![]()
Matterport Q1 2022 Infographic
Matterport Q1 2022 Infographic
2022 GlobeNewswire, Inc., source

