- Subscription revenue rose 20% year-over-year, above Company guidance
- Services revenue increased 74% year-over-year
- Q2 GAAP loss per share of
$0.23 - Non-GAAP loss per share of
$0.12 , better than Company guidance Matterport increases full year revenue guidance range to$132 to$138 million , narrows full year guidance range for non-GAAP loss per share to$0.46 to$0.50 - Balance sheet remains strong with
$562 million cash and investments and no debt
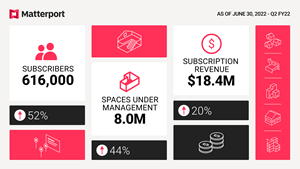
“We delivered another strong quarter, increasing our subscriber count by 52% to 616,000 subscribers. We expanded Spaces Under Management by 44% to over 8 million spaces,” said RJ Pittman, Chairman and Chief Executive Officer of
“We are pleased to report subscription revenue of
Second Quarter 2022 Financial Highlights
- Spaces Under Management (SUM) grew to 8.0 million, up 10% compared to the first quarter of 2022
- Total subscribers increased to 616,000, up 10% sequentially
- Subscription revenue was
$18.4 million , up 7% sequentially - Total revenue was
$28.5 million , flat sequentially - Annualized Recurring Revenue (ARR) exiting the second quarter was
$73.6 million - Exited Q2 with record product backlog
Recent Business Highlights
Acquired VHT Studios to accelerate adoption of digital twins for real estate. The combination of VHT Studios’ visual media technology and services with the immersiveMatterport 3D Digital Twin platform is expected to elevate the buying and leasing experience while simplifying the process of creating comprehensive marketing packages for enterprise brokerages and agents- Partnered with CGS, a global provider of applications, enterprise learning, and outsourcing services, to deliver virtual training solutions for front-line workers across the Fortune 500
- Completed SOC 2 Type II standards for confidentiality, a key requirement for many Fortune 500 customers and other enterprise organizations evaluating the deployment of digital twins
- Donated digital twin technology to SBP, formerly known as the
St. Bernard Project , to help disaster-affected communities accelerate theFEMA appeals process - Appointed
Susan Repo to the board of directors and to serve as chair of the audit committee.Ms. Repo is the Chief Financial Officer of ICEYE and also serves on the board of directors of Mitek Systems, Inc. (Nasdaq: MITK) andGM Financial Bank
Full Year and Third Quarter 2022 Outlook
| Q3 2022 Guidance | FY 2022 Guidance | |
| Revenue (in millions) | ||
| Subscription Revenue (in millions) | ||
| Non-GAAP loss per share | ( | ( |
| Weighted average fully diluted shares outstanding (in millions) | 288 | 286 |
Non-GAAP Financial Information
The presentation of these non-GAAP financial measures are not meant to be considered in isolation or as a substitute for comparable GAAP financial measures and should be read only in conjunction with the Company’s consolidated financial statements prepared in accordance with GAAP. For further information regarding these non-GAAP measures, including the reconciliation of these non-GAAP financial measures to their most directly comparable GAAP financial measures, please refer to the financial tables below.
Non-GAAP Net Loss and Non-GAAP Net Loss Per Share, Basic and Diluted.
Conference Call Information
About
©2022
Forward-Looking Statements
This press release contains certain forward-looking statements within the meaning of the federal securities laws, including statements regarding the services offered by
Forward-looking statements are predictions, projections and other statements about future events that are based on current expectations and assumptions and, as a result, are subject to risks and uncertainties. Many factors could cause actual future events to differ materially from the forward-looking statements in this document, including Matterport’s ability to implement business plans, forecasts, and other expectations in the industry in which
Investor Contact:
VP, Investor Relations
ir@matterport.com
Media Contact:
press@matterport.com
CONDENSED CONSOLIDATED STATEMENTS OF OPERATIONS
(In thousands, except per share data)
(Unaudited)
| Three Months Ended | Six Months Ended | ||||||||||||||
| 2022 | 2021 | 2022 | 2021 | ||||||||||||
| Revenue: | |||||||||||||||
| Subscription | $ | 18,386 | $ | 15,281 | $ | 35,527 | $ | 29,081 | |||||||
| License | 26 | 2,099 | 49 | 4,359 | |||||||||||
| Services | 5,013 | 2,879 | 8,986 | 5,568 | |||||||||||
| Product | 5,056 | 9,244 | 12,429 | 17,424 | |||||||||||
| Total revenue | 28,481 | 29,503 | 56,991 | 56,432 | |||||||||||
| Costs of revenue: | |||||||||||||||
| Subscription | 6,109 | 3,384 | 11,371 | 6,635 | |||||||||||
| License | — | — | — | — | |||||||||||
| Services | 3,169 | 2,290 | 6,152 | 4,325 | |||||||||||
| Product | 7,490 | 6,015 | 15,846 | 10,930 | |||||||||||
| Total costs of revenue | 16,768 | 11,689 | 33,369 | 21,890 | |||||||||||
| Gross profit | 11,713 | 17,814 | 23,622 | 34,542 | |||||||||||
| Operating expenses: | |||||||||||||||
| Research and development | 21,518 | 7,090 | 47,520 | 13,115 | |||||||||||
| Selling, general, and administrative | 59,385 | 16,501 | 130,234 | 29,559 | |||||||||||
| Total operating expenses | 80,903 | 23,591 | 177,754 | 42,674 | |||||||||||
| Loss from operations | (69,190 | ) | (5,777 | ) | (154,132 | ) | (8,132 | ) | |||||||
| Other income (expense): | |||||||||||||||
| Interest income | 1,484 | 14 | 2,779 | 22 | |||||||||||
| Interest expense | — | (277 | ) | — | (585 | ) | |||||||||
| Change in fair value of warrants liabilities | 4,714 | — | 26,147 | — | |||||||||||
| Change in fair value of contingent earn-out liability | — | — | 136,043 | — | |||||||||||
| Other expense, net | (1,353 | ) | (149 | ) | (2,674 | ) | (347 | ) | |||||||
| Total other income (expense) | 4,845 | (412 | ) | 162,295 | (910 | ) | |||||||||
| Income (loss) before provision for income taxes | (64,345 | ) | (6,189 | ) | 8,163 | (9,042 | ) | ||||||||
| Provision for income taxes | 289 | 20 | 893 | 39 | |||||||||||
| Net income (loss) | $ | (64,634 | ) | $ | (6,209 | ) | $ | 7,270 | $ | (9,081 | ) | ||||
| Net income (loss) per share attributable to common stockholders: | |||||||||||||||
| Basic | $ | (0.23 | ) | $ | (0.15 | ) | $ | 0.03 | $ | (0.22 | ) | ||||
| Diluted | $ | (0.23 | ) | $ | (0.15 | ) | $ | 0.02 | $ | (0.22 | ) | ||||
| Weighted-average shares used in computing net income (loss) per share attributable to common stockholders: | |||||||||||||||
| Basic | 283,405 | 41,348 | 279,289 | 40,490 | |||||||||||
| Diluted | 283,405 | 41,348 | 313,834 | 40,490 | |||||||||||
CONDENSED CONSOLIDATED BALANCE SHEETS
(In thousands)
(Unaudited)
| 2022 | 2021 | ||||||
| ASSETS | |||||||
| Current assets: | |||||||
| Cash and cash equivalents | $ | 113,923 | $ | 139,519 | |||
| Restricted cash | — | 468 | |||||
| Short-term investments | 362,300 | 264,931 | |||||
| Accounts receivable, net | 14,521 | 10,879 | |||||
| Inventories | 6,475 | 5,593 | |||||
| Prepaid expenses and other current assets | 15,377 | 16,313 | |||||
| Total current assets | 512,596 | 437,703 | |||||
| Property and equipment, net | 25,750 | 14,118 | |||||
| Operating lease right-of-use assets | 3,087 | — | |||||
| Long-term investments | 85,842 | 263,659 | |||||
| 54,080 | — | ||||||
| Intangible assets, net | 4,875 | — | |||||
| Other assets | 3,302 | 3,696 | |||||
| Total assets | $ | 689,532 | $ | 719,176 | |||
| LIABILITIES AND STOCKHOLDERS’ EQUITY | |||||||
| Current liabilities | |||||||
| Accounts payable | $ | 14,685 | $ | 12,227 | |||
| Deferred revenue | 14,302 | 11,074 | |||||
| Accrued expenses and other current liabilities | 21,228 | 10,026 | |||||
| Total current liabilities | 50,215 | 33,327 | |||||
| Warrants liability | 1,691 | 38,974 | |||||
| Contingent earn-out liability | — | 377,576 | |||||
| Deferred revenue, non-current | 288 | 874 | |||||
| Other long-term liabilities | 6,131 | 262 | |||||
| Total liabilities | 58,325 | 451,013 | |||||
| Stockholders’ equity: | |||||||
| Common stock | $ | 28 | $ | 25 | |||
| Additional paid-in capital | 1,099,617 | 737,735 | |||||
| Accumulated other comprehensive loss | (7,650 | ) | (1,539 | ) | |||
| Accumulated deficit | (460,788 | ) | (468,058 | ) | |||
| Total stockholders’ equity | 631,207 | 268,163 | |||||
| Total liabilities and stockholders’ equity | $ | 689,532 | $ | 719,176 | |||
CONDENSED CONSOLIDATED STATEMENTS OF CASH FLOWS
(In thousands, unaudited)
| Six Months Ended | |||||||
| 2022 | 2021 | ||||||
| CASH FLOWS FROM OPERATING ACTIVITIES | |||||||
| Net income (loss) | $ | 7,270 | $ | (9,081 | ) | ||
| Adjustments to reconcile net income (loss) to net cash provided by (used in) operating activities: | |||||||
| Depreciation and amortization | 5,563 | 2,608 | |||||
| Amortization of debt discount | — | 135 | |||||
| Amortization of investment premiums, net of accretion of discounts | 1,829 | — | |||||
| Stock-based compensation, net of amounts capitalized | 87,233 | 1,259 | |||||
| Change in fair value of warrants liabilities | (26,147 | ) | — | ||||
| Change in fair value of contingent earn-out liability | (136,043 | ) | — | ||||
| Deferred income taxes | 69 | — | |||||
| Allowance for doubtful accounts | 195 | 151 | |||||
| Loss on disposal of property, plant, and equipment | — | 7 | |||||
| Other | 316 | 43 | |||||
| Changes in operating assets and liabilities, net of effects of businesses acquired: | |||||||
| Accounts receivable | (3,426 | ) | (2,918 | ) | |||
| Inventories | (881 | ) | 1,024 | ||||
| Prepaid expenses and other assets | (2,946 | ) | (1,269 | ) | |||
| Accounts payable | 2,367 | 1,466 | |||||
| Deferred revenue | 2,641 | 3,024 | |||||
| Accrued expenses and other liabilities | 3,682 | 920 | |||||
| Net cash used in operating activities | (58,278 | ) | (2,631 | ) | |||
| CASH FLOWS FROM INVESTING ACTIVITIES: | |||||||
| Purchases of property and equipment | (866 | ) | (326 | ) | |||
| Capitalized software and development costs | (7,086 | ) | (3,256 | ) | |||
| Purchase of investments | (87,997 | ) | — | ||||
| Maturities of investments | 160,124 | — | |||||
| Investment in convertible notes | — | (1,000 | ) | ||||
| Business acquisitions, net of cash acquired | (30,020 | ) | — | ||||
| Net cash provided by (used in) investing activities | 34,155 | (4,582 | ) | ||||
| CASH FLOW FROM FINANCING ACTIVITIES: | |||||||
| Payment of transaction costs related to reverse recapitalization | — | (1,204 | ) | ||||
| Proceeds from sales of shares through employee equity incentive plans | 4,892 | 1,342 | |||||
| Payments for taxes related to net settlement of equity awards | (34,424 | ) | — | ||||
| Proceeds from exercise of warrants | 27,844 | — | |||||
| Repayment of debt | — | (2,390 | ) | ||||
| Other | 76 | — | |||||
| Net cash used in financing activities | (1,612 | ) | (2,252 | ) | |||
| Net change in cash, cash equivalents, and restricted cash | (25,735 | ) | (9,465 | ) | |||
| Effect of exchange rate changes on cash | (329 | ) | (104 | ) | |||
| Cash, cash equivalents, and restricted cash at beginning of year | 139,987 | 52,250 | |||||
| Cash, cash equivalents, and restricted cash at end of period | $ | 113,923 | $ | 42,681 | |||
RECONCILIATION OF GAAP TO NON-GAAP FINANCIAL MEASURES
(In thousands, except per share amounts)
(unaudited)
| Three Months Ended | Six Months Ended | |||||||||||||||
| 2022 | 2021 | 2022 | 2021 | |||||||||||||
| GAAP net income/(loss) | $ | (64,634 | ) | $ | (6,209 | ) | $ | 7,270 | $ | (9,081 | ) | |||||
| Stock-based compensation expense(1) | 32,889 | 601 | 88,977 | 1,259 | ||||||||||||
| Acquisition-related costs(2) | 900 | — | 1,072 | — | ||||||||||||
| Amortization expense of acquired intangible assets | 265 | — | 525 | — | ||||||||||||
| Change in fair value of warrants liabilities(3) | (4,714 | ) | — | (26,147 | ) | — | ||||||||||
| Change in fair value of contingent earn-out liability(4) | — | — | (136,043 | ) | — | |||||||||||
| Payroll tax related to contingent earn-out share issuance(5) | — | — | 1,164 | — | ||||||||||||
| Non-GAAP net loss | $ | (35,294 | ) | $ | (5,608 | ) | $ | (63,182 | ) | $ | (7,822 | ) | ||||
| GAAP net income (loss) per share attributable to common stockholders: | ||||||||||||||||
| Basic | $ | (0.23 | ) | $ | (0.15 | ) | $ | 0.03 | $ | (0.22 | ) | |||||
| Diluted | $ | (0.23 | ) | $ | (0.15 | ) | $ | 0.02 | $ | (0.22 | ) | |||||
| Non-GAAP net loss per share attributable to common stockholders, basic and diluted | $ | (0.12 | ) | $ | (0.03 | ) | $ | (0.23 | ) | $ | (0.05 | ) | ||||
| GAAP weighted-average shares used to compute net income (loss) per share, basic | 283,405 | 41,348 | 279,289 | 40,490 | ||||||||||||
| Weighted-average effect of potentially dilutive securities(6) | — | — | 34,545 | — | ||||||||||||
| GAAP weighted-average shares used to compute net income (loss) per share, diluted | 283,405 | 41,348 | 313,834 | 40,490 | ||||||||||||
| Excluded anti-dilutive weighted-average potential shares of common stock in calculating non-GAAP loss per share | — | — | (34,545 | ) | — | |||||||||||
| Adjustment for common stock issued in connection with the merger(7) | — | 127,499 | — | 127,499 | ||||||||||||
| Non-GAAP weighted-average shares used to compute net loss per share, basic and diluted | 283,405 | 168,847 | 279,289 | 167,989 | ||||||||||||
(1) Consists primarily of non-cash share-based compensation related to the Company's stock incentive plans and earn-out arrangement.
(2) Consists of acquisition transaction costs.
(3) Consists of the non-cash fair value measurement change for public and private warrants.
(4) Represents the non-cash fair-value measurement change related to our earn-out liability.
(5) Represents the payroll tax related to Earn-out shares issuance and release.
(6) Consists of the potentially dilutive effect of employee equity incentive plan awards.
(7) Consists of non-GAAP adjustment of unweighted average common stock issued and converted from
A photo accompanying this announcement is available at https://www.globenewswire.com/NewsRoom/AttachmentNg/feca6b90-2fd3-4ac3-96c2-4a312e082011

![]()
Matterport Q2 2022 Infographic
Matterport Q2 2022 Infographic
2022 GlobeNewswire, Inc., source

