|
End-of-day quote
Other stock markets
|
5-day change | 1st Jan Change | ||
| 55.32 EUR | -4.82% |
|
+2.10% | - |
| Market Cap | 32.19B 27.8B 25.62B 23.98B 44.94B 3,060B 45.64B 303B 118B 1,489B 121B 118B 5,157B | P/E Ratio 2026 * |
25.9x | P/E Ratio 2027 * | 19.5x |
|---|---|---|---|---|---|
| Enterprise Value | 28.77B 24.85B 22.9B 21.43B 40.17B 2,734B 40.79B 270B 105B 1,331B 108B 106B 4,608B | EV / Sales 2026 * |
0.15x | EV / Sales 2027 * | 0.14x |
| Free-Float |
78.63% | Yield 2026 * |
-
| Yield 2027 * | - |
Last Transcript: Centene Corporation

| 1 day | -4.82% | ||
| 1 week | +2.10% |
| 1 week | 53.64 | 58.16 | |
| 1 month | 53.64 | 58.16 | |
| Current year | 53.64 | 58.16 | |
| 1 year | 53.64 | 58.16 | |
| 3 years | 53.64 | 58.16 | |
| 5 years | 53.64 | 58.16 | |
| 10 years | 53.64 | 58.16 |
| Manager | Title | Age | Since |
|---|---|---|---|
Sarah London
CEO | Chief Executive Officer | 45 | 2022-03-21 |
Drew Asher
DFI | Director of Finance/CFO | 57 | 2021-05-06 |
Susan Smith
COO | Chief Operating Officer | 50 | 2023-05-31 |
| Director | Title | Age | Since |
|---|---|---|---|
| Chairman | 67 | 2023-03-30 | |
Jessica Blume
BRD | Director/Board Member | 71 | 2018-02-04 |
H. Dallas
CHM | Chairman | 67 | 2022-02-22 |
| Change | 5-day change | 1-year change | 3-year change | Capi.($) | ||
|---|---|---|---|---|---|---|
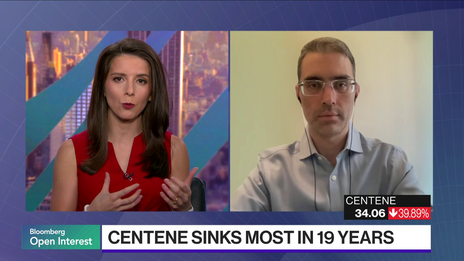
| -4.82% | +2.10% | - | - | 31.38B | ||
| +0.73% | +2.27% | +28.26% | -17.07% | 368B | ||
| +1.23% | -2.76% | +4.62% | -14.55% | 86.69B | ||
| +1.07% | +2.94% | -5.51% | +11.61% | 77.99B | ||
| +2.86% | +8.32% | +61.40% | -26.11% | 44.27B | ||
| +3.66% | +4.94% | -31.76% | -30.62% | 10.06B | ||
| -2.42% | +28.50% | +30.97% | +166.17% | 4.18B | ||
| -3.47% | +23.50% | +61.43% | +395.18% | 2.58B | ||
| +3.82% | +2.98% | +23.57% | -32.58% | 2.01B | ||
| Average | +0.22% | +8.75% | +21.62% | +56.51% | 74.51B | |
| Weighted average by Cap. | +0.35% | +2.41% | +22.00% | -10.83% |
| 2026 * | 2027 * | |
|---|---|---|
| Net sales | 190B 164B 152B 142B 266B 18,095B 270B 1,789B 698B 8,808B 714B 699B 30,496B | 191B 165B 152B 142B 266B 18,141B 271B 1,794B 699B 8,830B 716B 701B 30,574B |
| Net income | 1.22B 1.06B 973M 910M 1.71B 116B 1.73B 11.49B 4.48B 56.54B 4.59B 4.49B 196B | 1.64B 1.41B 1.3B 1.22B 2.28B 155B 2.32B 15.37B 5.99B 75.68B 6.14B 6.01B 262B |
| Net Debt | -3.42B -2.96B -2.72B -2.55B -4.78B -325B -4.85B -32.17B -12.54B -158B -12.85B -12.57B -548B | -4.81B -4.15B -3.83B -3.58B -6.71B -457B -6.82B -45.18B -17.62B -222B -18.04B -17.66B -770B |
| Date | Price | Change | Volume |
|---|---|---|---|
| 26-06-12 | 55.32 € | -4.82% | 0 |
| 26-06-10 | 58.12 € | +7.83% | 371 |
| 26-06-08 | 53.90 € | -0.52% | 190 |
| 26-06-05 | 54.18 € | -0.24% | 0 |


Trader
This super rating is the result of a weighted average of the rankings based on the following ratings: Valuation (Composite), EPS Revisions (4 months), and Visibility (Composite). We recommend that you carefully review the associated descriptions.
Investor
This super composite rating is the result of a weighted average of the rankings based on the following ratings: Fundamentals (Composite), Valuation (Composite), EPS Revisions (1 year), and Visibility (Composite). We recommend that you carefully review the associated descriptions.
Global
This composite rating is the result of an average of the rankings based on the following ratings: Fundamentals (Composite), Valuation (Composite), Financial Estimates Revisions (Composite), Consensus (Composite) and Visibility (Composite). The company must be covered by at least 4 of these 5 ratings for the calculation to be carried out. We recommend that you carefully review the associated descriptions.
Quality
This composite rating is the result of an average of rankings based on the following ratings: Returns (Composite), Profitability (Composite) and Quality of Financial Reporting (Composite), and Financial Health (Composite). The company must be covered by at least 2 of these 3 ratings for the calculation to be performed. We recommend that you carefully read the associated descriptions.
ESG MSCI
The MSCI ESG score assesses a company’s environmental, social, and governance practices relative to its industry peers. Companies are rated from CCC (laggard) to AAA (leader). This rating helps investors incorporate sustainability risks and opportunities into their investment decisions.


Quarterly revenue - Rate of surprise

- Stock Market
- Stocks
- CNC Stock
- QEN Stock
Select your edition
All financial news and data tailored to specific country editions


